Summertime Sadness – How To Adjust For Seasonality In PPC

As we approach the summer months, many businesses are either ramping up or pulling back on PPC and other marketing efforts. It is crucial that as the agency, we fully understand seasonality and the underlying business cycles that drive these decisions. This insight helps us determine strategy and tactics to get the highest impact possible out of paid efforts. Today, we’ll go through how to go about looking for seasonal trends and how to budget for the year.
Use Analytics To View Trends
I’ve said it before, and I’ll say it again, Google Analytics is a great resource. For seasonality, we want to get a holistic view of what’s going on over the course of a year. Here’s a simple custom report that you can build to view data by month.

Another item to note is that GA only allows you to export 5,000 rows of data. Because of this limitation, you might want to trim it down and exclude source/mediums that are a small piece of the pie. To do this, apply a filter using a regular expression to include source/medium contains:
google / organic|none|google / cpc|bing / organic
If you need a refresher on regular expressions, read here.
Once you build the report, I like to pull it into Excel to pivot to my heart’s content (seriously guys, I spend like 90% of my time pivoting). First, we’ll need to separate out the month from year or Analytics will export it as such:

Simply make use of the LEFT and RIGHT functions to separate the data into two columns. Now that our data is ready to pivot, let’s see what it looks like.

If you’re using the 2016 version of Excel, it’s a great time to use pivot table slicers! If you haven’t used them before, think of them as fancy filters that you can link to multiple pivot tables.
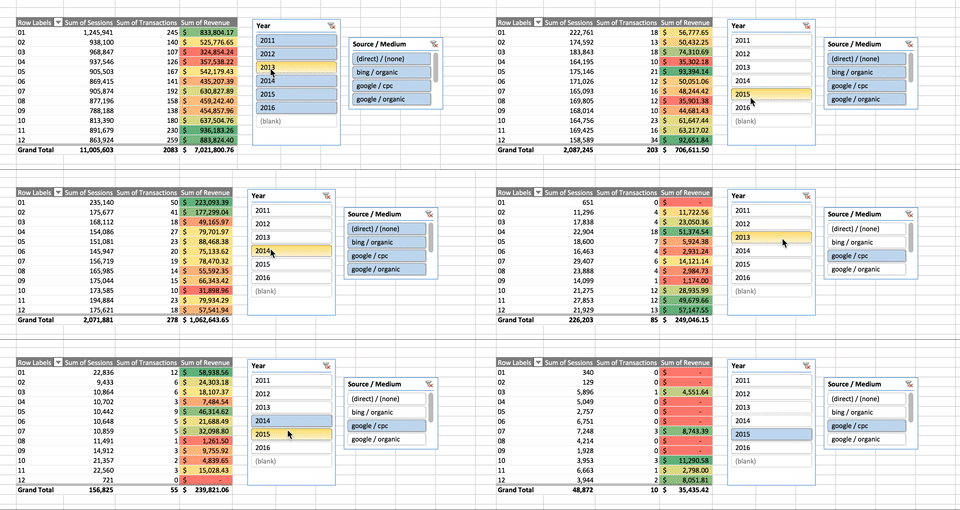
Notice I included user engagement metrics in the first pivot. I want to see how engaged users are throughout the months, which can be a good indicator of how seriously they’re researching a purchase.
So, what are we looking for here? What are the takeaways?
- What months have the highest average order value?
- Which months have the highest conversion rate?
- How do pageviews of key pages change and why?
- Which months see a spike in organic or direct traffic, and how can we capitalize?
Use Available AdWords Data / Past Performance
If your PPC accounts have been around for a while, you’re in luck. Get in there and look at the past few years of data. In particular, take a look at Auction Insights. Either segment by quarter within the interface, or go ahead and segment by month and (you guessed it) download it into Excel.
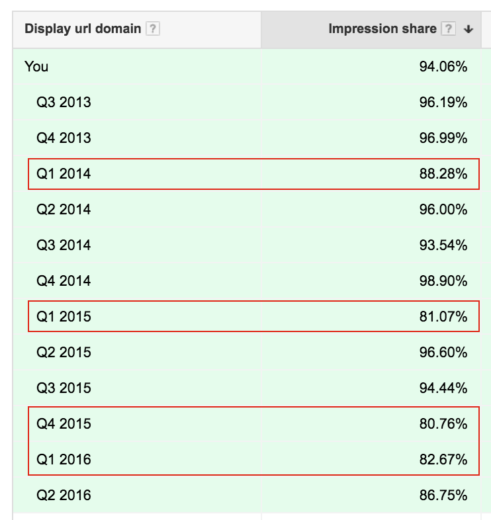
For this client, Q1 and Q4 are the busiest months in terms of sales. The campaign shown above is a branded campaign, and you’ll notice that our impression share tends to dip in Q1, exactly when we need it to be highest. Next, we would take a look at what our competitors’ IS looks like on these branded terms to find out who has entered the market and who has become more aggressive.
Now you’re probably wondering what else you can glean from old AdWords data. Take note of anything that performed particularly well in the past. It can be a certain campaign, keyword, or piece of ad copy. The client we’ve been using as an example thus far has seasonal sales, so we will periodically review past sale ad copy to determine the next test. Which brings us to our next point.
Use Seasonal Ad Copy
If you’re in a highly seasonal vertical, you will want to explore the idea of using seasonal ad copy to make yourself stand out. Again, it will be highly specific to your business.
Items to consider include:
- Why is this the busy season? (Weather? Holidays?)
- Why should a consumer be purchasing/filling out a lead form right now?
- Are you running any seasonal sales or promotions?
Look At What Your Competitors Are Doing
Auction Insights is a great way to preview the SERP without actually wasting impressions by Googling yourself. See what kinds of deals or promotions your competitors are running right now.
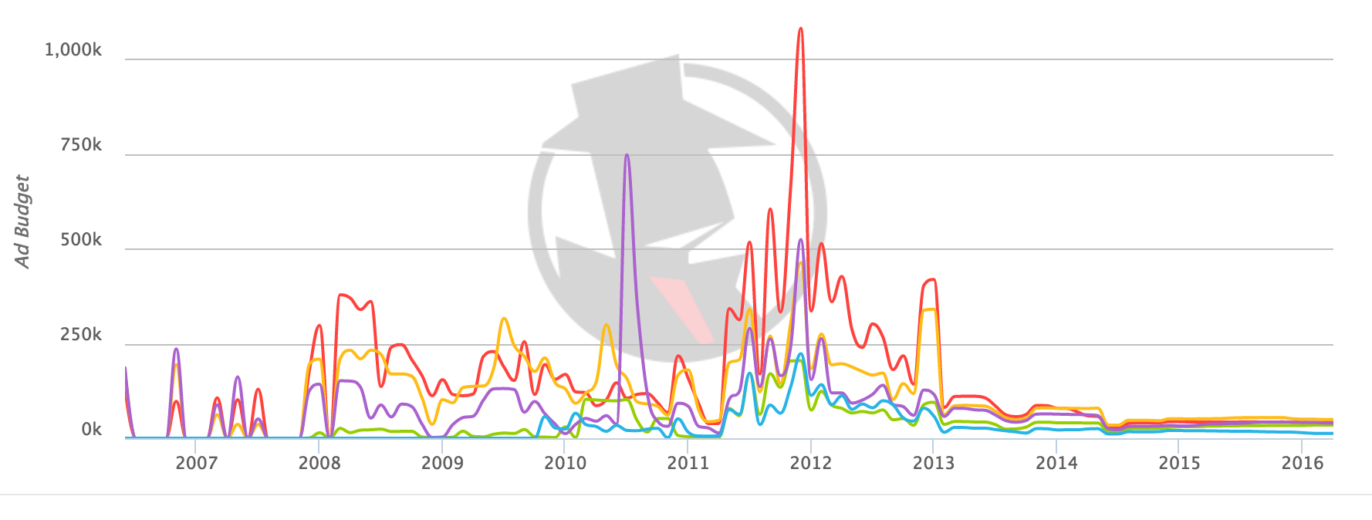
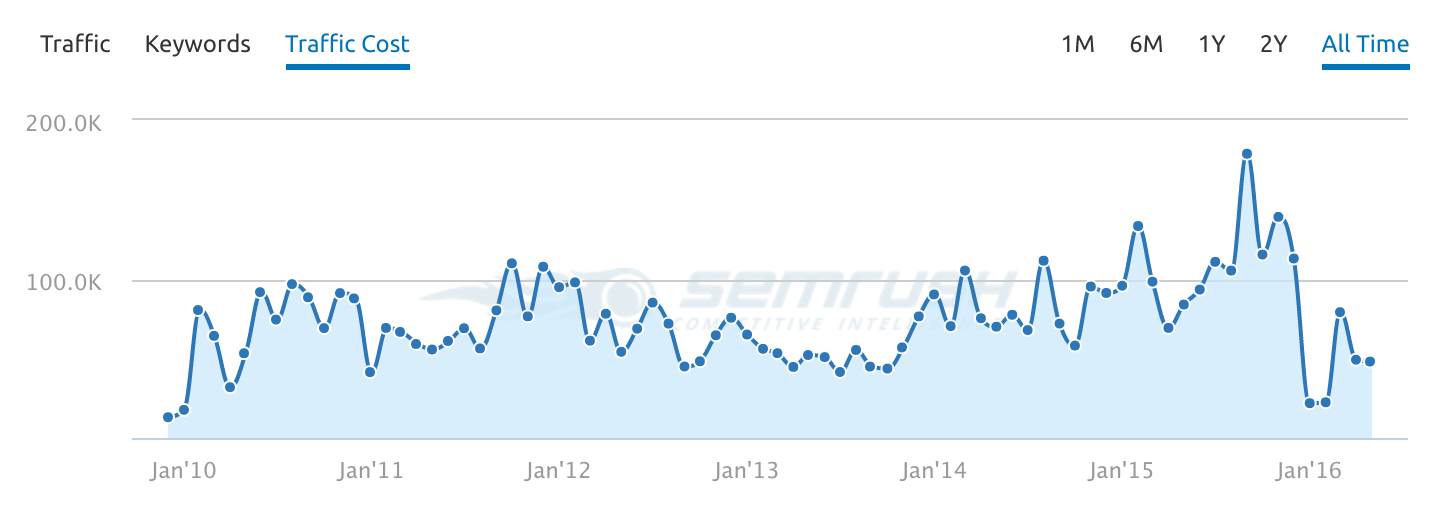
SpyFu and SEMrush will give you quick estimates on competitor budgets, but be wary, as these tools can be way off. Instead of looking at raw numbers, look at the trends. What months see increases or decreases?
Here’s an example of ad spend graphs from SpyFu and SEMrush (note that the SpyFu graph contains data for multiple competitors):
Budgeting
Now that you’ve gone through all of the above topics, it’s time to plan the budget (or give recommendations if you aren’t a decision maker).
In the example below, we were given an annual budget to work with. With some insights into seasonality along with areas of focus dictated by the client, we were able to allocate percentages of the budget monthly.
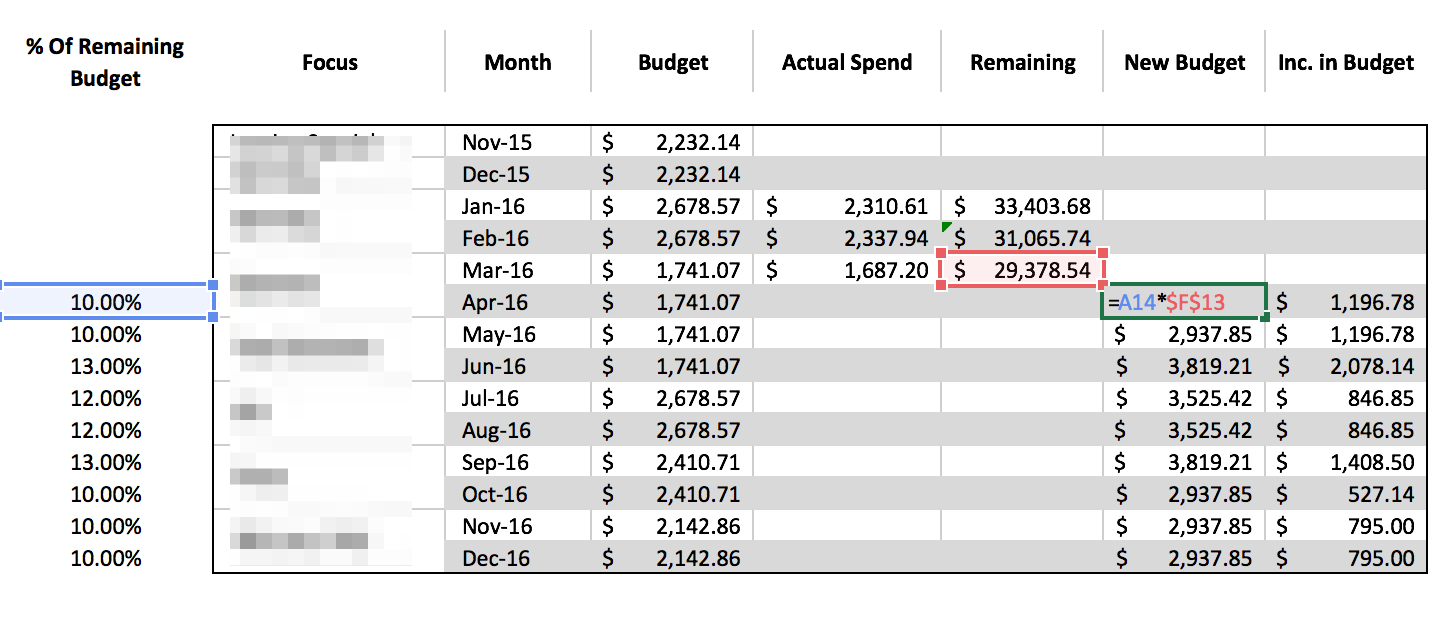
This is easy to do in Excel with basic multiplication and addition/subtraction formulas. It also provides an easy to digest view of the budget for the client to approve or make changes.
So What?
Budgeting is hugely important in the paid advertising space. In order to plan your strategy and tactics, you need to know how much you have to spend. In most cases cash is a limited resource, so being able to determine where you’ll get the most bang for your buck to stay competitive is important.
Not only do you need to think about the budget, but you also have to plan your strategy around seasonality. Whatever that means for your business, planning is crucial. Write your ad copy in advance and go ahead and schedule it to launch with automated rules. This way, you don’t be stressing about launching those ads at 11:50 PM the day before the sale starts.


