Effective Google Analytics AdWords Data Integration
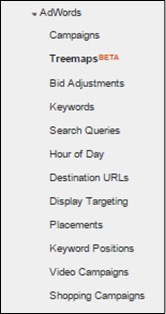
A huge topic in 2014 – ‘more data’ for AdWords users has been answered by Enhanced Google Analytics!
Throughout 2014, Google Analytics (GA) has been rolling out more integrated AdWords data, giving online marketers more insight into performance and behavioral features to analyze, report and base decisions.
GA has added the below AdWords features integrations. I’ll be going through some of the newer features that we find give us a better overview of our campaign performance.

Treemaps
The most recent of these updates is Treemaps. Although the name sounds like something out of a treasure hunt, it is in fact a top level visual view of AdWords campaign performance.
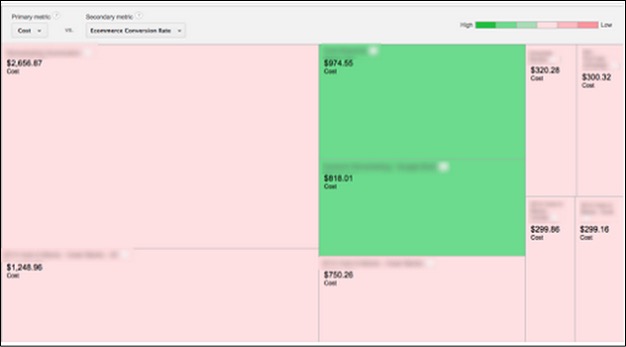
It is designed to illustrate performance on a High to Low scale and gives users a quick insight into their AdWords performance and can be adjusted by primary and secondary e-commerce and goal metrics.
GA defines the two metrics as:
“Primary metrics are volume metrics, and are represented by rectangle size.”
“Secondary metrics are relative metrics, and are represented by color and saturation. Green is positive and red is negative. The darker the green, the better the secondary metric, and the darker the red, the worse the secondary metric.”
This is very useful for GA users who want to compare AdWords data such as cost and RPC (Revenue Per Click) at a glance alongside GA data to get a more detailed snapshot into the account performance.
Search Queries
The second feature that we use is Search Queries. We compare this data to the search terms data in AdWords to obtain a more detailed insight into the performance of keywords and the terms that trigger them.
Metrics such as pages per session, bounce rate and session duration can also be helpful when reviewing landing pages and overall relevancy of the user’s journey. We all know that the more relevant a user journey is to their search, the more likely they are to convert!
Query Match Type
There is also a Query Match Type dimension which is extremely helpful when reviewing overall match type snapshot performance.

Based on your account strategy users can calculate the total percentage of a match type contribution to overall performance.
Our team always aim to refine and break out keywords based on performance, so depending on the nature of the account we would generally aim for a higher exact match percentage as this helps us to lower CPC’s and provides us with more control over the keywords.
This is therefore a great way to consistently analyze and report on this data.
Google Shopping
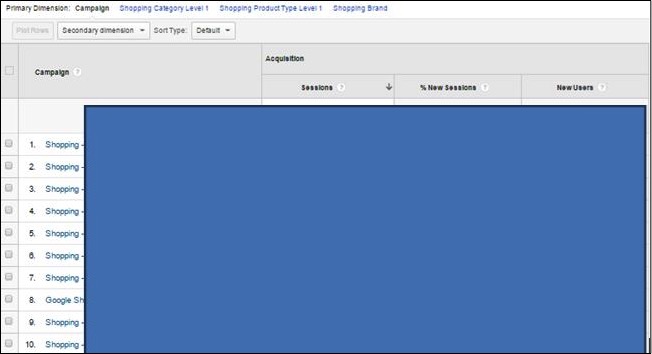
Another relatively new feature is the Google Shopping campaign report which allows advertisers to gain more insight into the overall product and category performance, as well as brand performance within the AdWords campaigns.
The report again combines e-commerce data alongside site engagement metrics to give online marketers more data to use when devising bid strategies, Google shopping feed and landing page optimizations.
Attribution Model Comparison
As most online advertisers should know, last click attribution is dead… or it should be. Until now, advertisers without 3rd party software would have found it difficult to report on and utilize attribution data.
GA has an introduced a feature where users can compare various AdWords attribution models within a 1-90 day period.
The dimensions can drill down to keyword level, which we find becomes really vital when illustrating non-brand performance and value to clients.
There are various types of models which are covered in more depth in this Google Analytics and Attribution Modeling Guide by our Head of R & D.
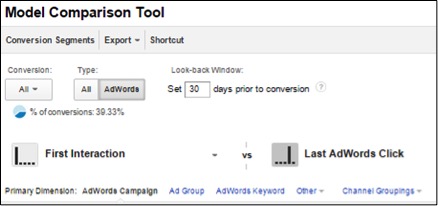
When comparing models and e-commerce metrics, GA provides: Conversions & CPA, Conversion Value & ROAS as well as Conversions & Value. What’s great is that this comparison alongside the AdWords dimension data really helps to illustrate the value of the paid click to those not so well versed in the complex world of attribution.
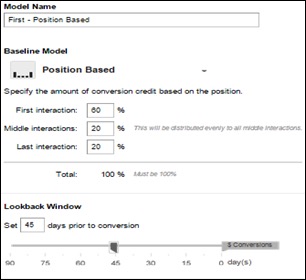
We generally find the most useful comparison is the position based model as it evenly weighs first and last click as well as those in-between, but this varies greatly based on the type of site and products sold.
Custom Attribution Models
We have also created custom models to help us understand, illustrate and report on online e-commerce sale cycles. The metrics allow you to set percentage of attribution however you see fit up to 100%, as well as setting the lookback window prior to the conversion from 1 to 90 days.
Bid Adjustments
Another major feature is Bid Adjustments. Here GA users can analyze and compare device, location and ad schedule percentage bid adjustments.
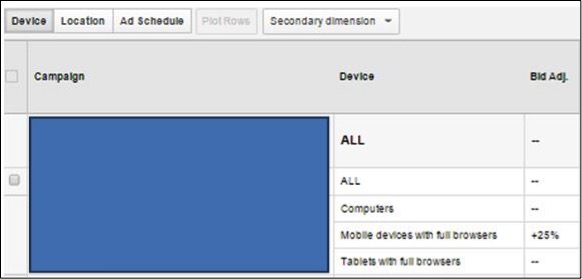
We find these incredibly useful when analyzing the effectiveness of bid adjustments performance especially at keyword level. When optimizing campaigns, users can add in relevant secondary dimensions metrics such as advertising, acquisitions and time which add a further layer of data.
For example, reports can be run on bid adjustment performance by hour and day of the week with bounce rates and conversion rates. This can provide analysts with increased granular data that they can then apply to their device and bid management strategies.
Overall
We find the most useful attribution models are ones that are customized and understand each sites e-commerce data, behavioral metrics, product and sales cycle. I would advise GA users to review all the integrated data alongside their AdWords data to make better informed decisions and not rely on either as definitive.
We should not be satisfied with a dimensional view of our data; we want to look at it from as many angles as possible, as it is through this thinking, analysis and reporting where we’ll find the most value for all parties involved.


