Industry Benchmarking Beta Now in Google Analytics

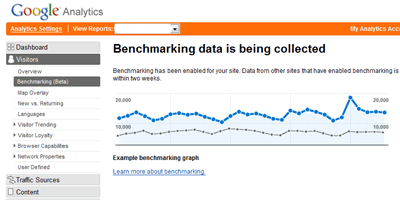
Curious to know how your company is doing compared to your industry at large? Google Analytics now offers a “benchmarking” report. According to the Google FAQ, the new benchmarking feature is an optional Google Analytics service that shows how your site’s stats compare against other industry verticals. Once you opt in to ‘share’ your data you will be able to compare your site’s visits, pageviews, pages per visit, bounce rate, average time on site, and number of new visits against benchmark data from across your industry.
This will allow you to become more knowledgeable on how your particular industry is performing and how you size up against your competitors. This service is located under the “Visitors” section of your Google Analytics reports. Select “Benchmarking (Beta)” to view this report. Be aware that it will take up to two weeks for the data to appear since it is being categorized and collected for your reports, says Google.

What I think is great about the new reporting feature is that you can select which categories you wish to compare your sites’ stats to. Once you opt in to the feature, under the visitors sections, select benchmarking. At that point you will be at the benchmarking report page, click open category list to expand the list of categories in which you can click the category you wish to compare your website against. This report will save and automatically populate the graphs with your selected category.
I will write a new post on the results of the new benchmarking beta once the information comes through. Stay tuned!


