Reducing Your Dependency on Google Traffic – Part I: Social Search


After decades at the top, seismic transformations to the way the internet is accessed means Google’s position as the gatekeeper of the internet is looking increasingly vulnerable. In this comprehensive study Ann Stanley, CEO of Anicca Digital, explores the ways you can expect some of these changes to affect your site traffic, and how you can pre-emptively adapt to reduce their impact in order to to keep the taps flowing.
In Part I Ann looks at the current state of play and the increase in the importance of social search, as users expand their horizons beyond the big G.
Introduction – internal and external factors impacting Google traffic
Google remains the dominant source of website traffic. The search giant is responsible for driving over 60% of web traffic in the USA and even more in the UK. This heavy reliance is increasingly risky, however, as Google faces significant challenges, both from within and without, that could reduce your site’s traffic.
Internal factors
In the first half of 2024, Google faced several self-inflicted issues that dented its reputation and market share:
- The public launch of their new AI Overviews (on 14th May) which has since been scaled back due to:
- Scary advice (so called “hallucinations”), such as; eating rocks every day, adding glue to you pizzas, drinking urine to clear kidney stones etc.
- Backlash from publishers when they realised they were providing all their content for Google’s AI Overviews, but they would no longer be getting clicks in return.
- A huge leak of internal documents that revealed many aspects of Google’s algorithm (and how it worked). This caused a major upset among SEOs, because Google had been deliberately denying or advising something different for years.
- Backlash against the “Useful content Updates”, where algorithm changes designed to combat spam, inadvertently reduced traffic to established and smaller blogs???, whilst benefiting other larger sites, such as Reddit.
External factors
Google’s dominance is also being increasingly challenged by other external factors and new competitors, including the growing influence of social search and Generative AI, which are reshaping how users are finding information, products and brands.
This blog will focus primarily on the following external factors;
- the source of website traffic and role of smaller search engines,
- the increasing impact of social platforms and social search away from the search engines.
- the impact of Generative AI on search engines
The author also suggests a number of strategies as to how you can reduce your dependence on Google traffic.
Part A – The importance of search in driving website traffic
The Role of Search in Driving Traffic (USA Data)
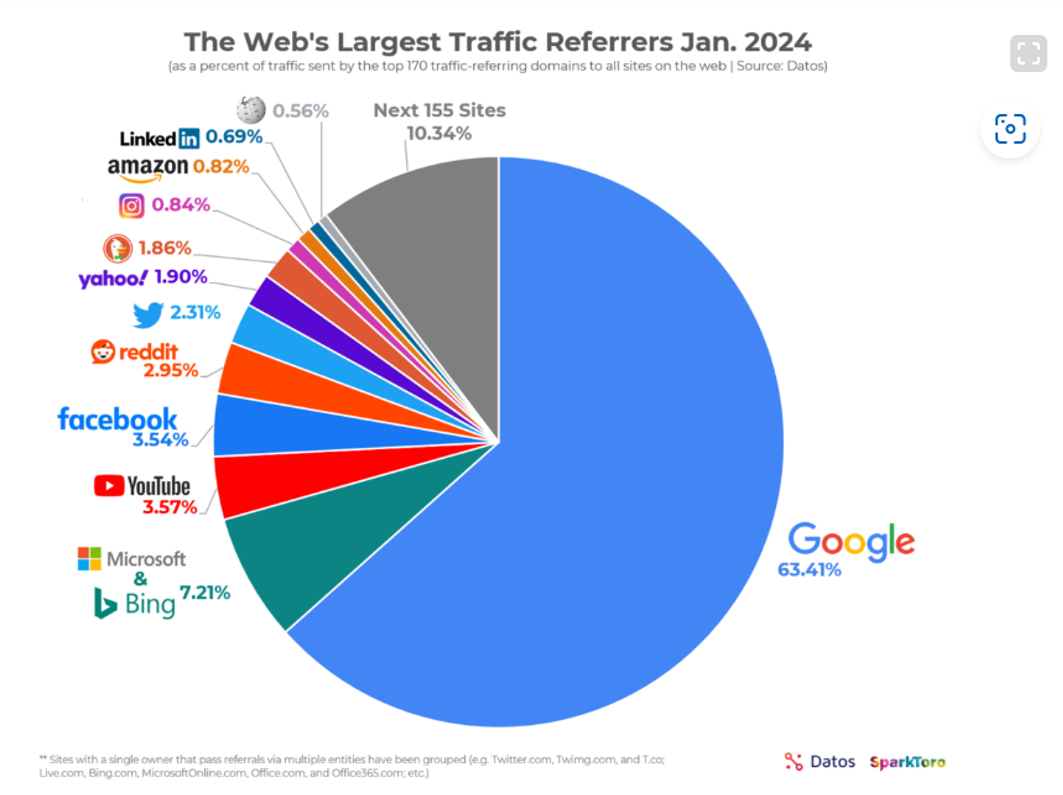
According to data from SparkToro and Datos, Google.com accounts for a staggering 64.3% of referrals to US sites. In contrast, Microsoft/Bing only sends 7.2% and social platforms like YouTube and Facebook contribute 3.48% and 3.62%, respectively.
Reddit refers 2.95% of traffic, while Twitter refers 2.31%. Interestingly, Reddit and Twitter/X send almost 8 times more traffic than LinkedIn, which only refers 0.69%.
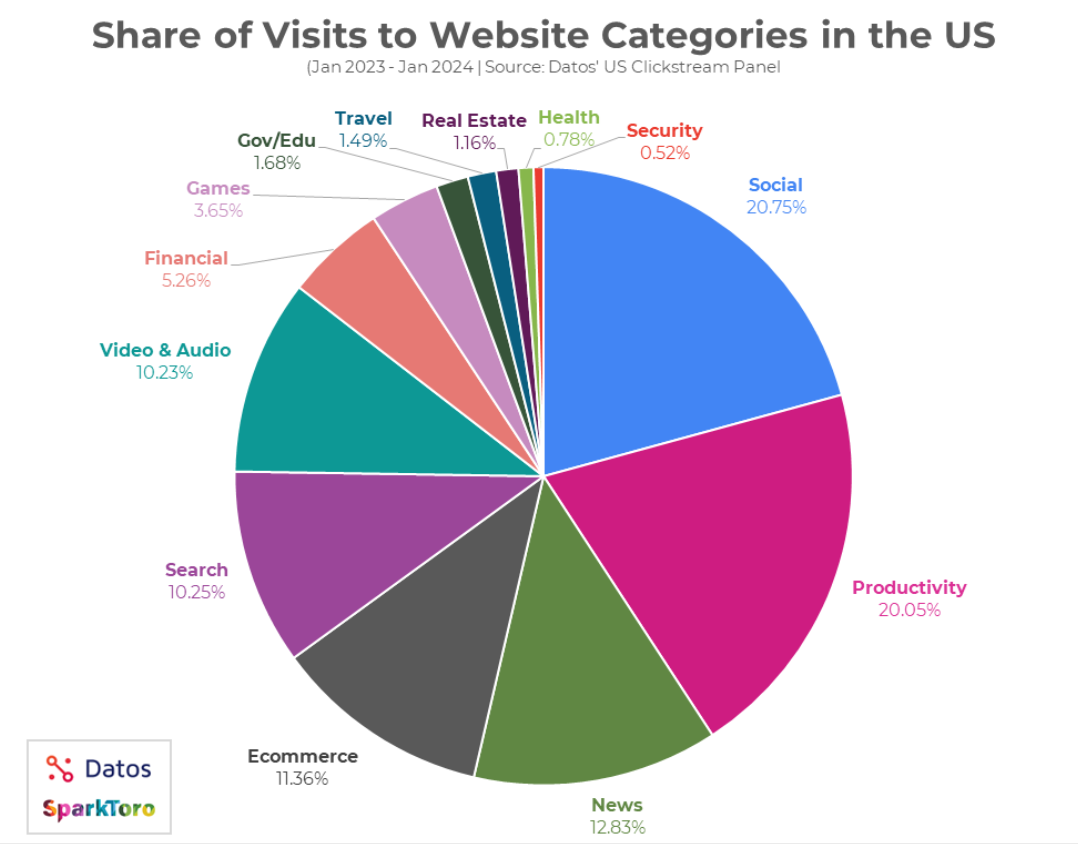
This is in contrast to the amount of time spent on these sites, as shown by the share of visits. This shows that social sites have more than 20% of all visits, reflecting that users spend more time there, but they may not want to leave to click through to another site. This could be because:
- Users of Social Search can find the answers within the social platforms without needing (or wanting) to leave the platform.
- Brands are not spending as much money on social ads that drive users to their site. Click/traffic or conversion ad campaigns are less effective than other ad types, because of privacy and other tracking issues (although this can be overcome by switching to server-side tracking and use of conversion APIs).
These factors suggest marketers need to optimise their content for both search and social search within social platforms, and leverage tools that can measure the effectiveness of their campaigns across different channels.
The Role of Search in Driving Traffic (UK Data from SimilarWeb)
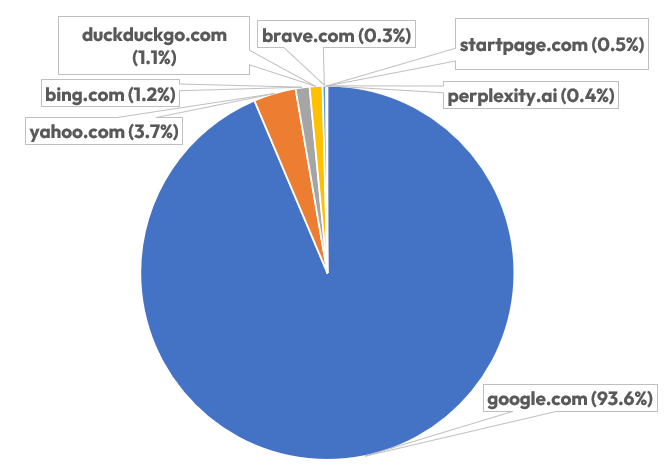
This dominance is not uniform across all regions. Below is April data from Similarweb for the UK looking at visits and unique visitors for 17 search engines.
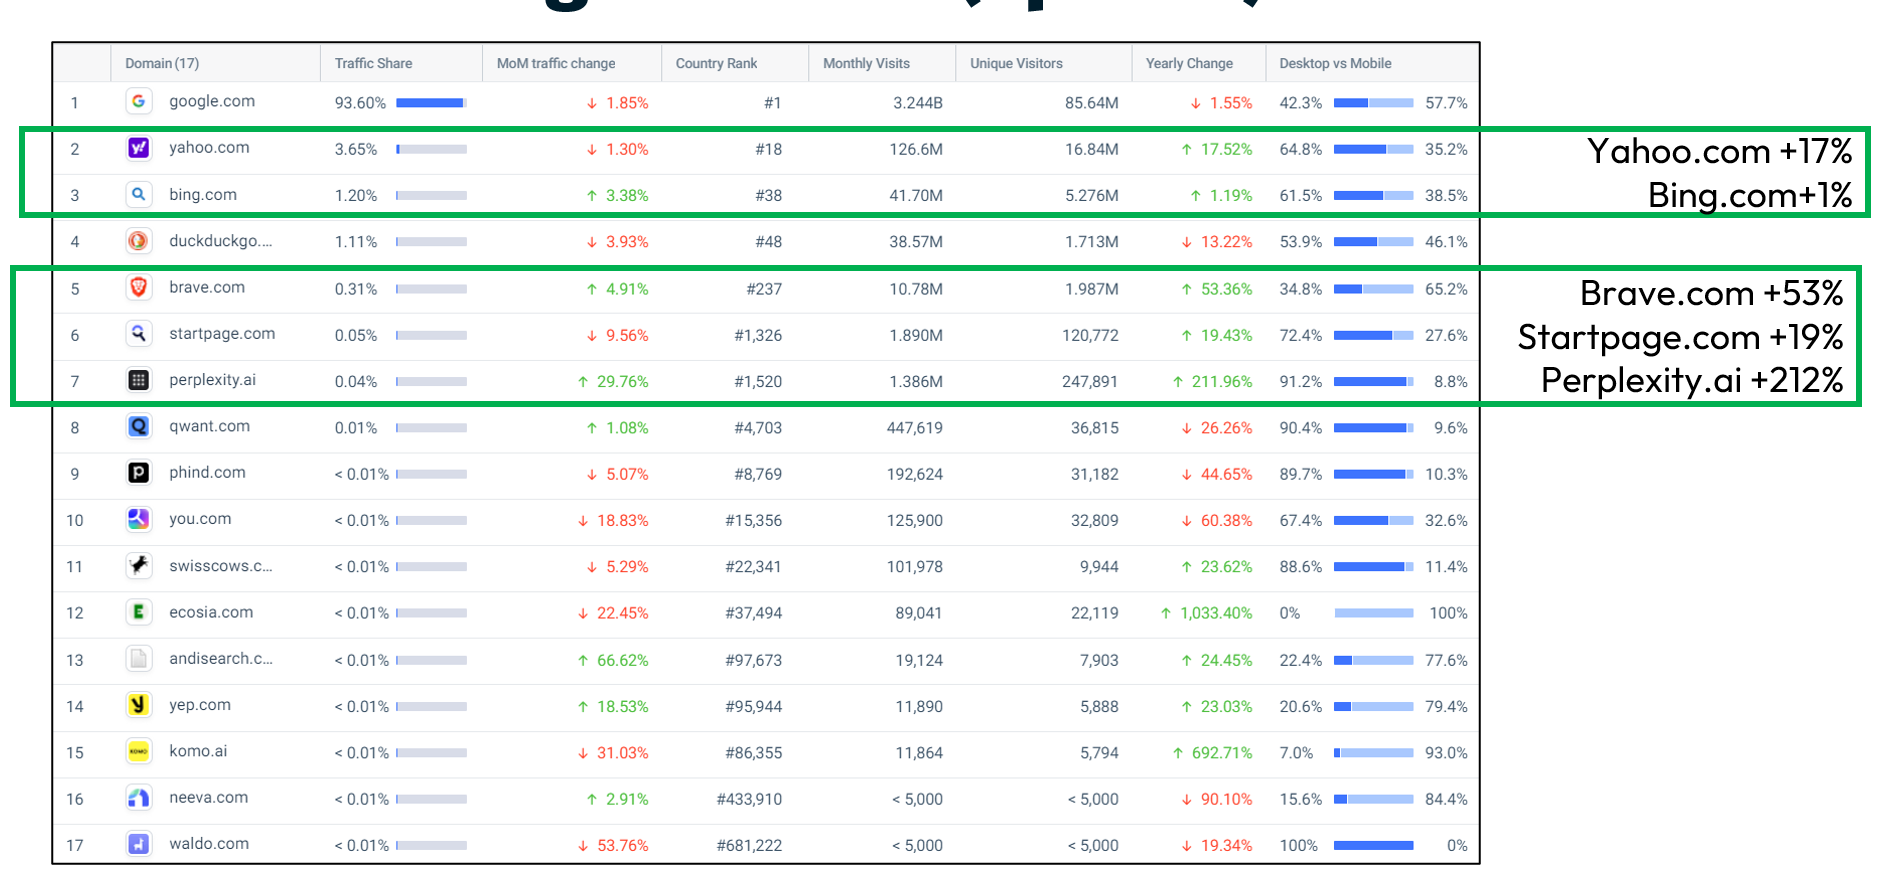
This shows that in the UK, Google commands 93.6% of search engine traffic, followed by Yahoo.com (3.7%) and Bing.com (1.2%). This also shows that:
- Google is more dominant in the UK than in the USA, so regional differences in search engine use matter for developing your local strategies.
- Some of the smaller search engines have grown a lot. For example, Perplexity.ai, which uses Generative AI in its results, has grown 212% in a year.
However, on closer inspection of the data for visits vs unique visitors, other conclusions can be drawn.
UK Search Engine Traffic Based on Visits vs Unique Visits (Data from Similarweb, April 2024):
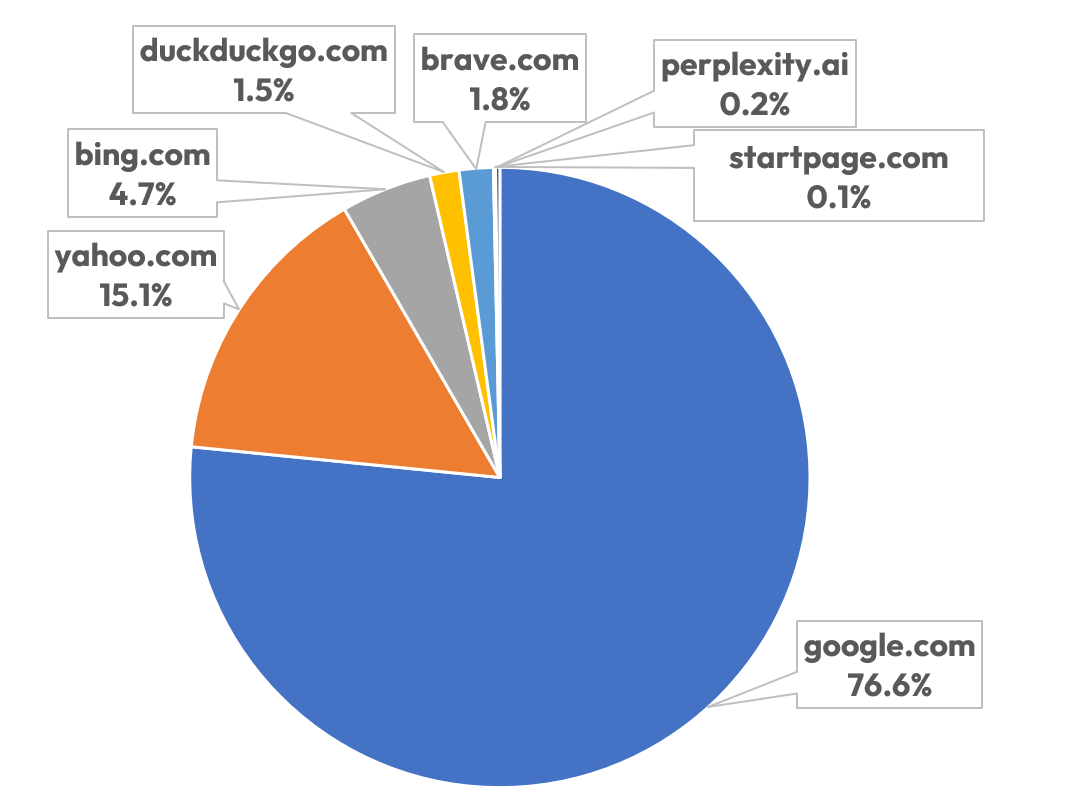
When the data is analysed based on the number of unique visitors, it reveals almost 25% are not using Google. This would support a diversification strategy, to allow you to access a third more users (potential customers) by having a strong presence in these other platforms – even though they don’t search as often as Google users.
Sources of traffic to UK sites (examples from two sectors)
In addition to the significant geographical differences in Google’s role in driving traffic, we can use Similarweb to highlight substantial variations across individual sites or sectors.
Larger brands are more likely to be discovered by users typing in the URL directly (direct traffic) or conducting brand searches (organic search traffic). In contrast, smaller or more competitive sectors, such as ecommerce, tend to rely more heavily on paid search, particularly the shopping and Performance Max ads that dominate search results.
To illustrate this, I have provided data below for two example sectors:
- Home and Garden (ecommerce) – a sample of 50 ecommerce sites, with a minimum of 25k visits per month, included big brands like Argos, Next, M&S, Dunelm, John Lewis etc.
- Property portals and estate agents (lead generation) – a sample of 27 sites, including Rightmove, Zoopla, On the Market, Prime Location, Purple Bricks etc.
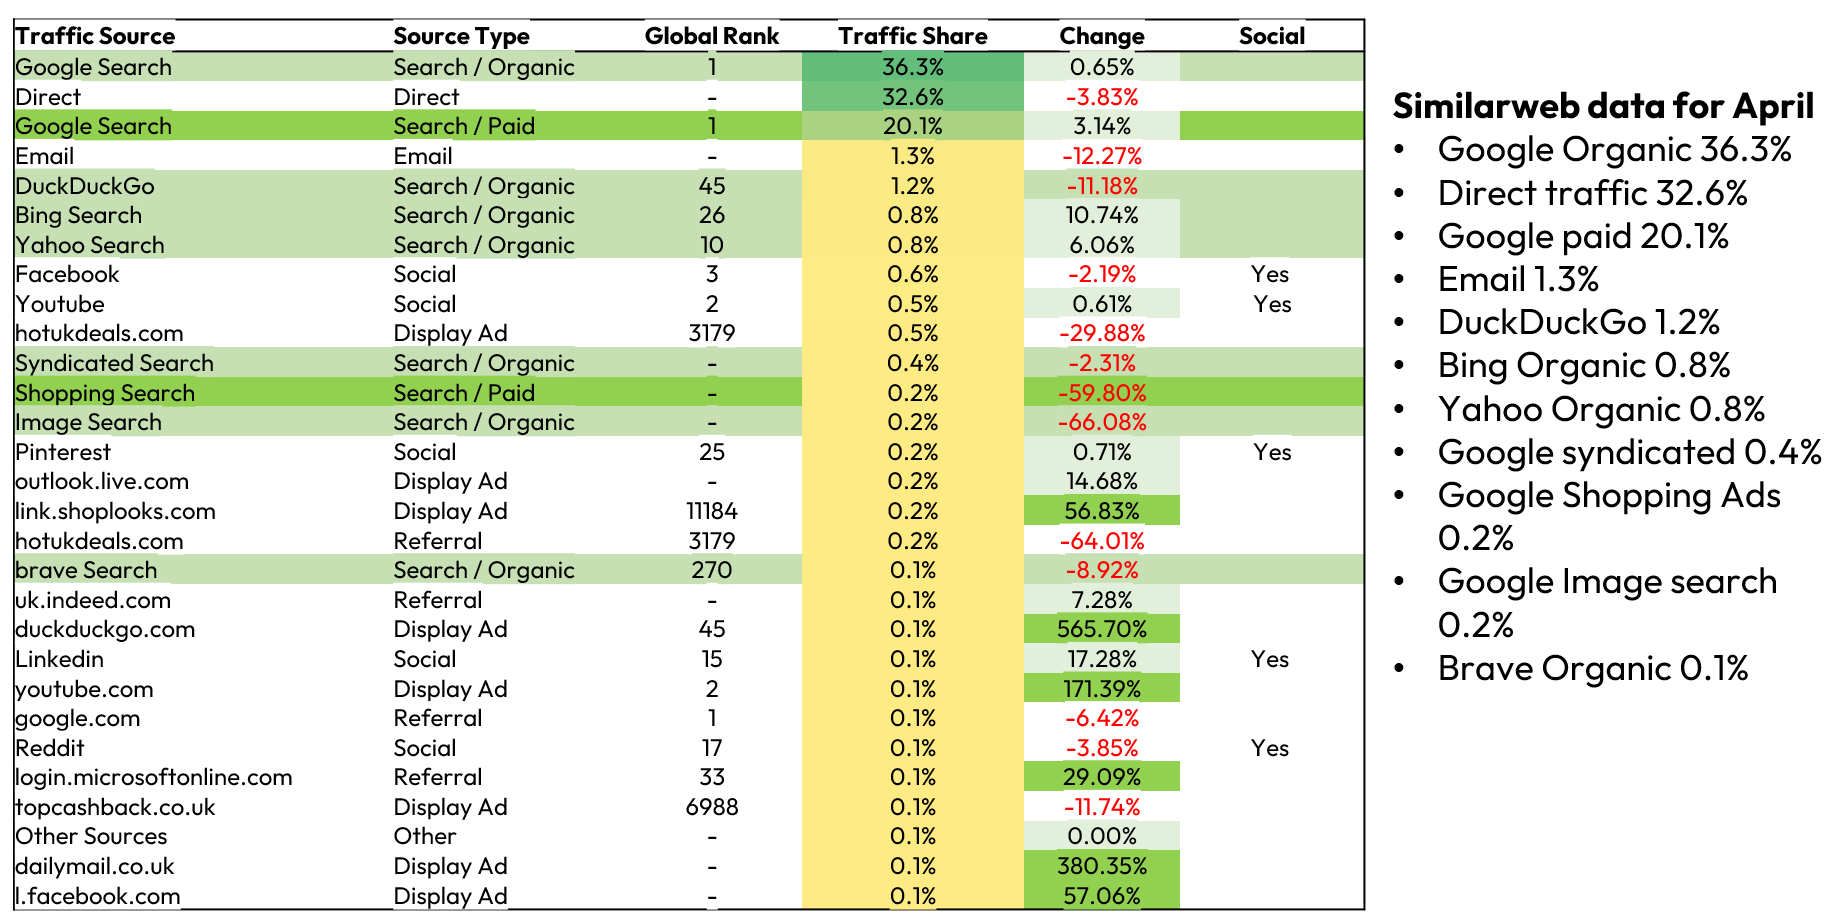
A. Traffic Sources for top 50 Home and Garden sites
Data for April 2024 from Similarweb on 50 top UK home and garden sites, reveals the distribution of traffic sources:
- Google Organic Search: 36.3%
- Direct Traffic: 32.6%
- Google Paid Search: 20.1%
- Other Sources: The remaining 11% of the traffic is spread across platforms like Bing, Yahoo, and various social media sites.
This data highlights the critical role of search engines in driving traffic, with Google leading both organic and paid search.
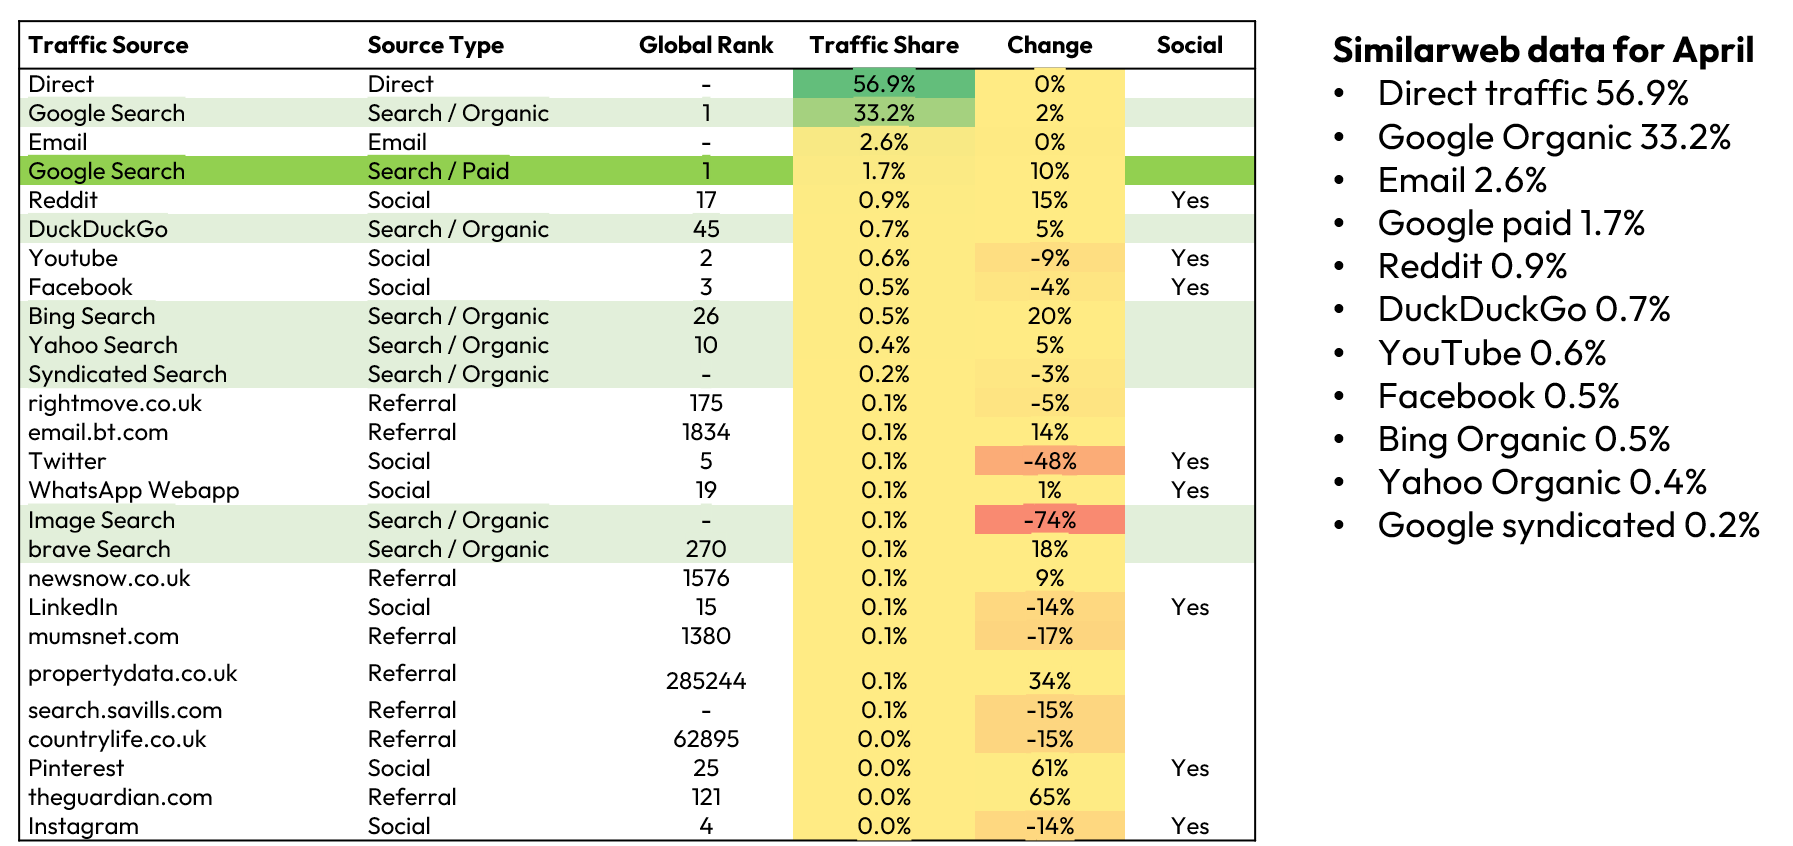
B. Traffic Sources for the top 27 Estate agent and property portal sites
Data for April 2024 from Similarweb on 27 top UK estate agent and property sites, reveals the distribution of traffic sources:
- Direct Traffic: 56.9%
- Google Organic Search: 33.2%
- Other Sources: The remaining 10% of traffic is spread across channels like paid search, Email, Reddit, DuckDuckGo, Bing, Yahoo, and various social media sites.
Most of the traffic came from the 5 big property portals, which had 96% of the market share (based on visits). The portals had many direct visitors, but Google organic search also brought in a third of the traffic. Direct traffic and Google organic combined accounted for 90% of the traffic, with little reliance on paid search (1.7%),
Search beyond Traditional Search Engines – Social Search
Consumers are increasingly turning to non-traditional search platforms like TikTok and Reddit for information and product discovery.
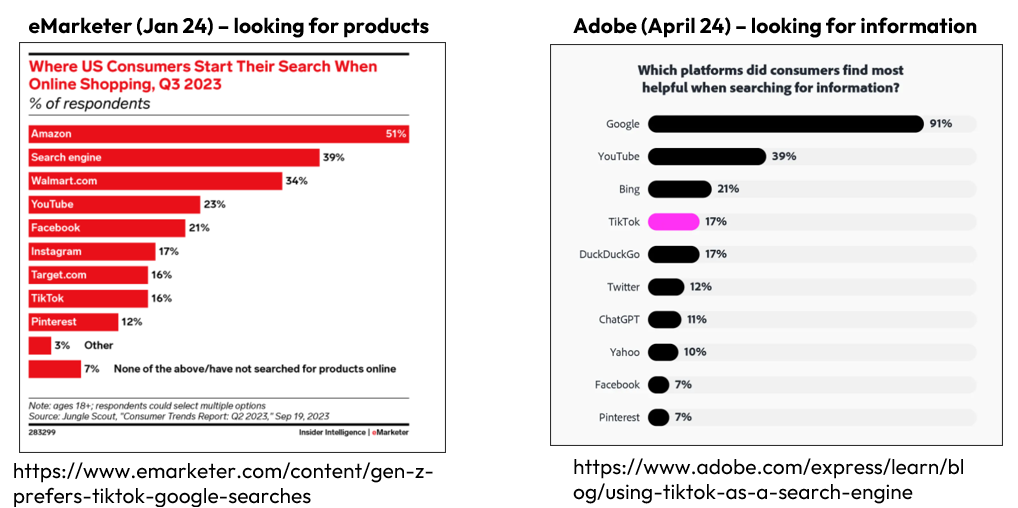
US Data from eMarketer and Adobe, illustrate the big differences between searching for a product and information. Although Google is still in the top 2 for both activities, the other main platforms are very different:
- Searching for products – Amazon (51%) is the most popular platform to start a product search, followed by search engines (39%), Brands or Retail Media (such as Walmart and Target), and social search (YouTube, Facebook, Instagram, Pinterest and TikTok)
Searching for information – This is still dominated by Google (91%) and YouTube is also strong at 39%. However, the next two are more surprising with Bing at 21%, TikTok at 17% (similar percentage as for product searches). Even ChatGPT gets a mention at 11%.
A new model for search, based on action not platform
As the data above indicates, people search across various platforms besides regular search engines. Heather Physioc, in her recent talk at InOrbit 24, discussed this idea and recommended that marketers view search as an activity that happens at all stages of the sales funnel, on many different platforms, not just on search engines (see her key slide below).
The Importance of TikTok as a social search engine
Over the last year, TikTok has increasingly demonstrated its potential as a marketing platform for brands, and especially after launching the TikTok Shop, allowing buyers to purchase within the platform.
This increasing role as a marketing channel is due to the diverse ways in which TikTok’s audience engages with the platform and, more recently, as a social search engine:
- Fun and Learning: Users interact with content for fun, education and amusement (its where they spend their time).
- Discovery Platform: Brands can reach users based on interests and behaviours through sponsored videos and display ads.
- Marketplace: Brands can sell their products directly on TikTok for only 5% commission.
- Influencer Network: Content creators can endorse products to their fans in exchange for a commission or fee.
- Social Search Platform: Users actively look for information and products.
As the data above indicates, TikTok is a significant platform for finding products (16%) and information (17%). However, the relevance of TikTok varies depending on the demographics of the users and also relates to specific products and services of interest to these individuals.
This is shown in the key findings from a HerCampus study published in eMarketer:
- 64% of Gen Z users use TikTok for social search.
- 51% prefer TikTok over Google for obtaining information.
- 74% favour TikTok over Google for product searches.
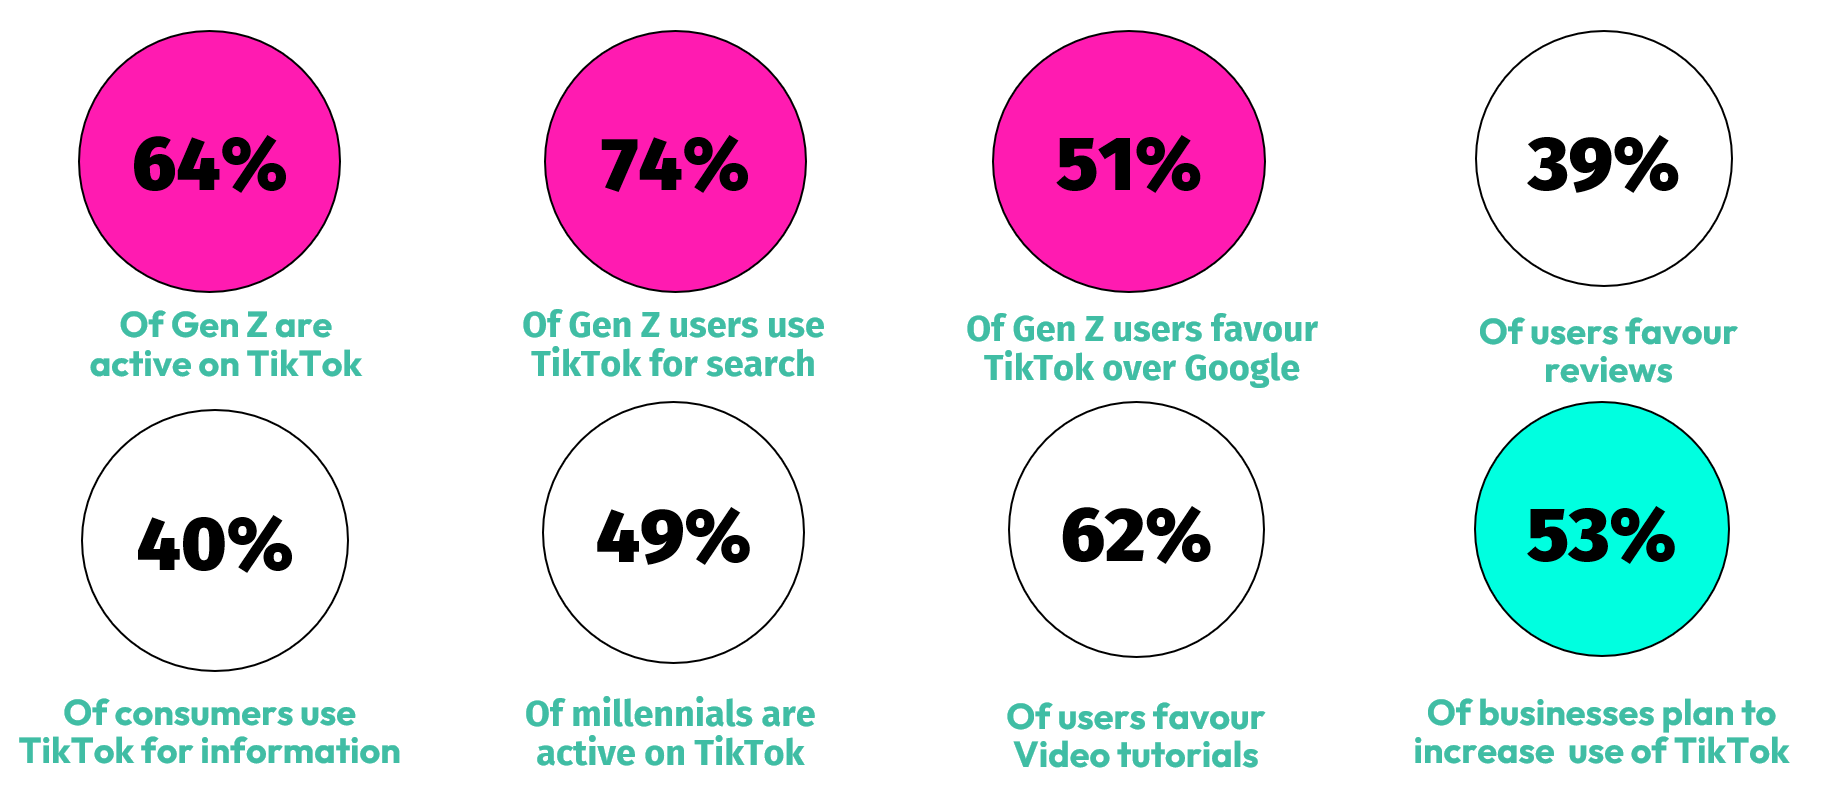
Similarly, the data from the Adobe study showed:
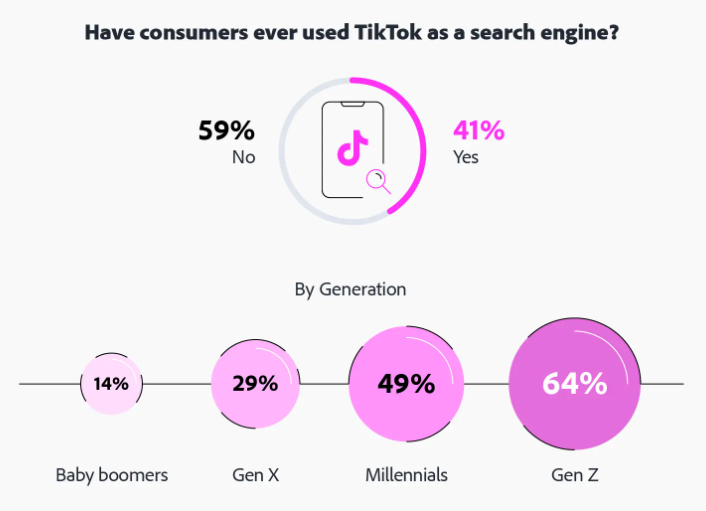
- 41% of Americans use TikTok as a search engine
- 64% of Gen Zer’s use TikTok as a search engine
- Nearly 10% of Gen Zer’s are more likely to rely on TikTok than Google as a search engine
- More than half of business owners (54%) use TikTok to promote their business, posting an average of 9 times per month
25% of small business owners use TikTok influencers for product sales or promotions.
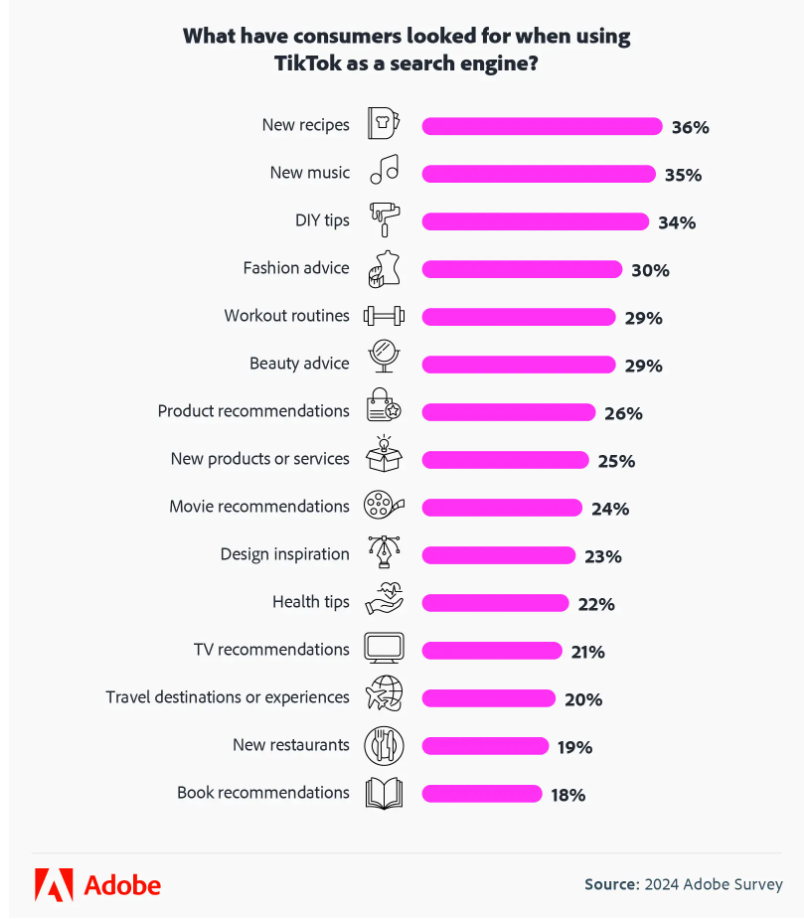
This research also showed some of the popular search topics on TikTok include:
- New recipes: 36%
- New music: 35%
- DIY tips: 34%
- Fashion advice: 30%
- Workout routines: 29%
- Beauty advice: 29%
- Using different tools to compare search volume in TikTok and Google
To find out if their product or service would do well on TikTok, marketers need to access data easily without creating an ad account. In this section I have given some examples of tools that can help with this task.
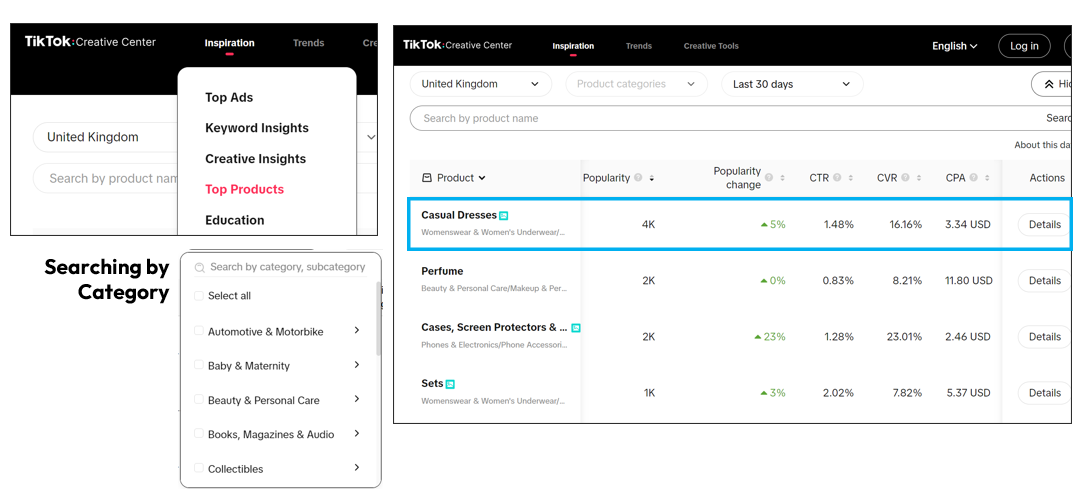
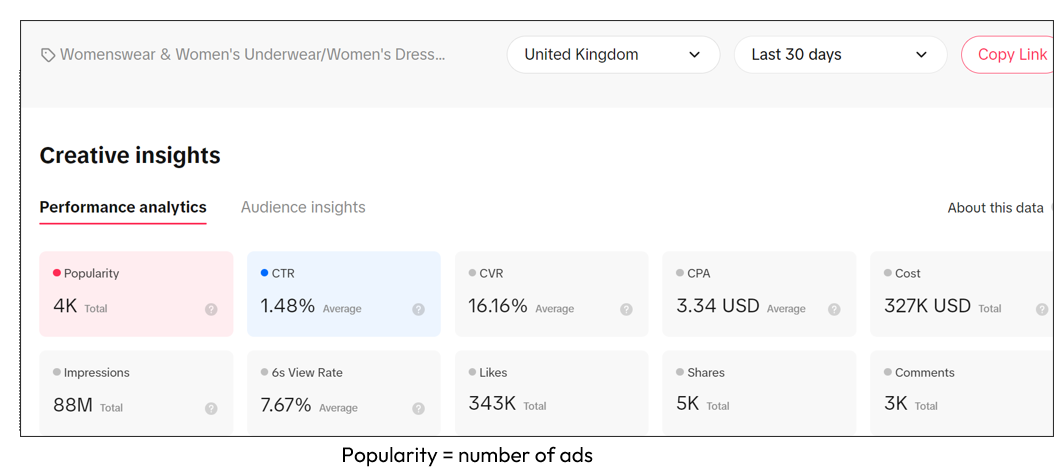
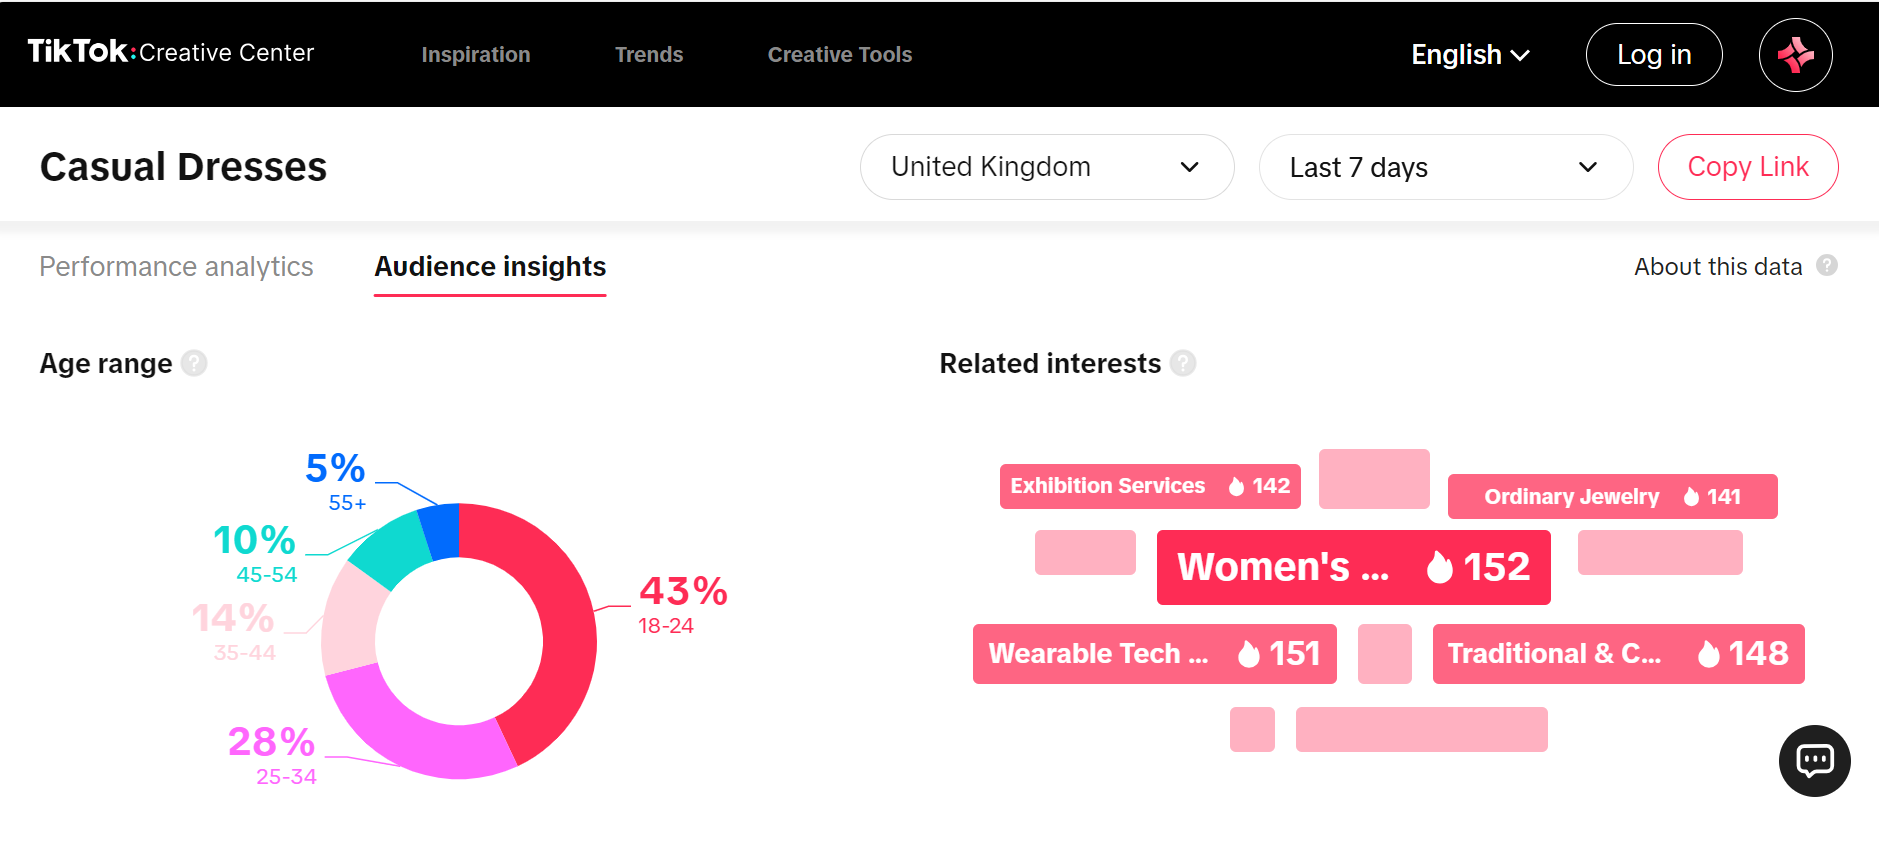
A. TikTok Creative Center
The screenshots below demonstrate how the TikTok Creative Center can help you access the Top Products and Keyword Insights, to learn about search volumes and popularity (number of ads) on TikTok.
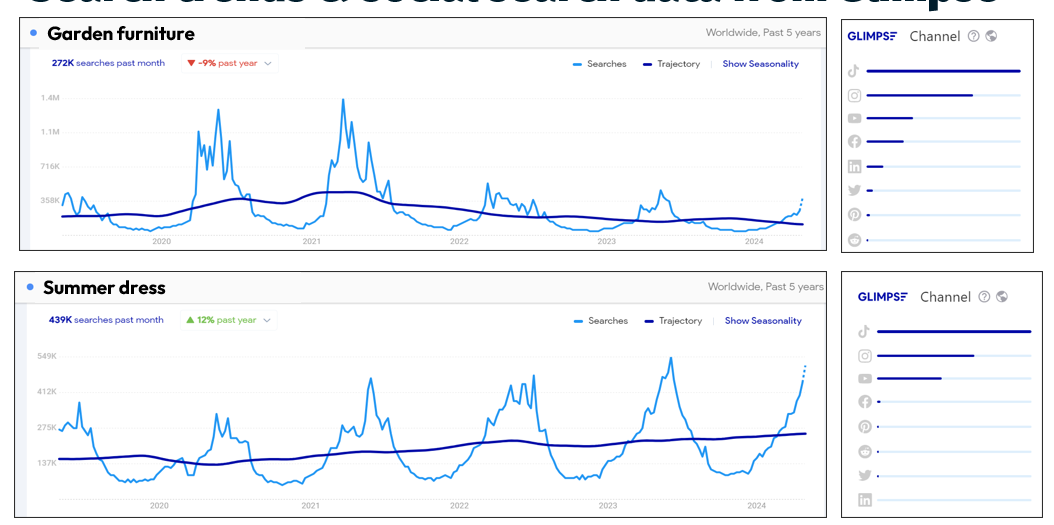
Data using the Chrome extension Glimpse (based on Google Trends)
The Glimpse Chrome Extension helps you understand how often and how much people search on Google. You can do 10 searches per month for free, and it provides more detailed data than Google’s Trends. The data shows the actual number of searches, not just a percentage, and how they changed from the previous year. In addition, it provides you with more information and charts on social search (relative volume), as shown in the screen grabs below for “Garden furniture” and “Summer dress”.
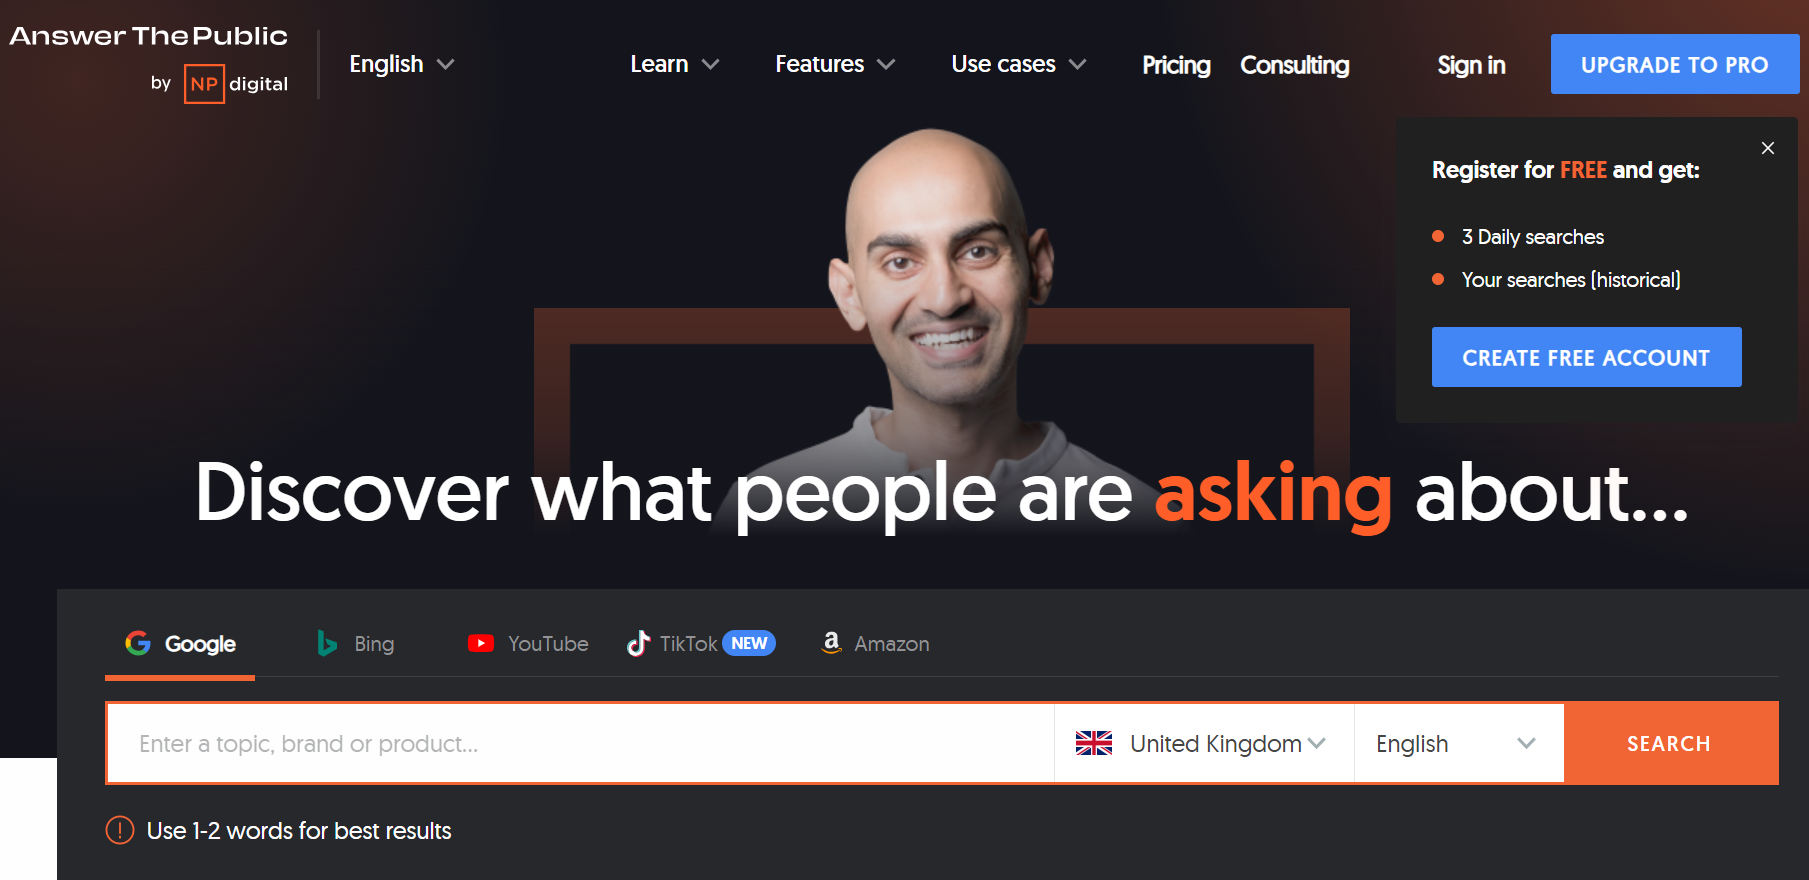
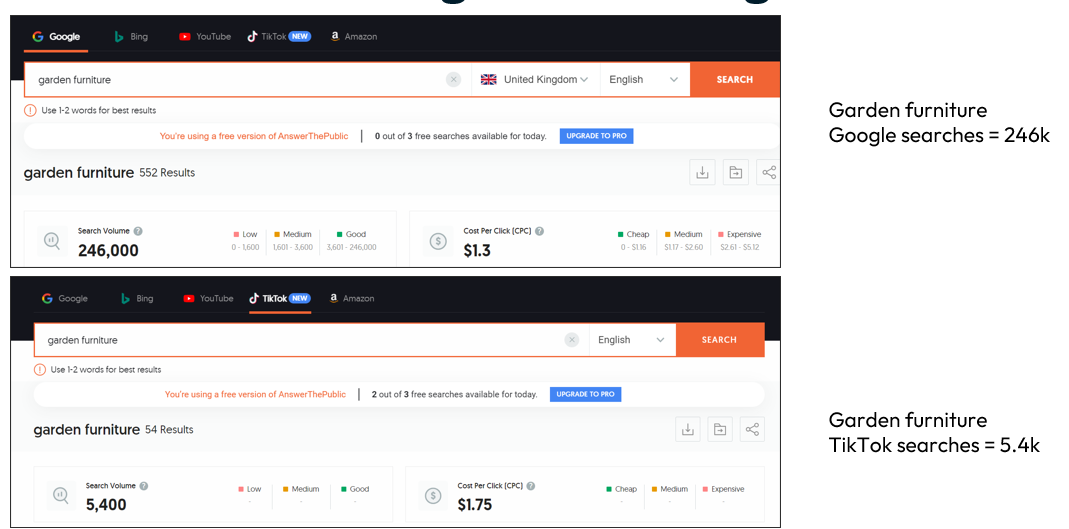
C. Search volume data in Google and TikTok using Answer the Public
Answer the Public is well-known for showing the queries people type into Google on your chosen topics. It uses Google Autocomplete searches and provides a word-cloud of questions based on your topic, along with search volume and competition data.
The tool was acquired by Neil Patel 2 years ago, and although you only get a few searches free each day before needing to upgrade to a paid package, it does allow you to directly compare search volumes across several platforms.
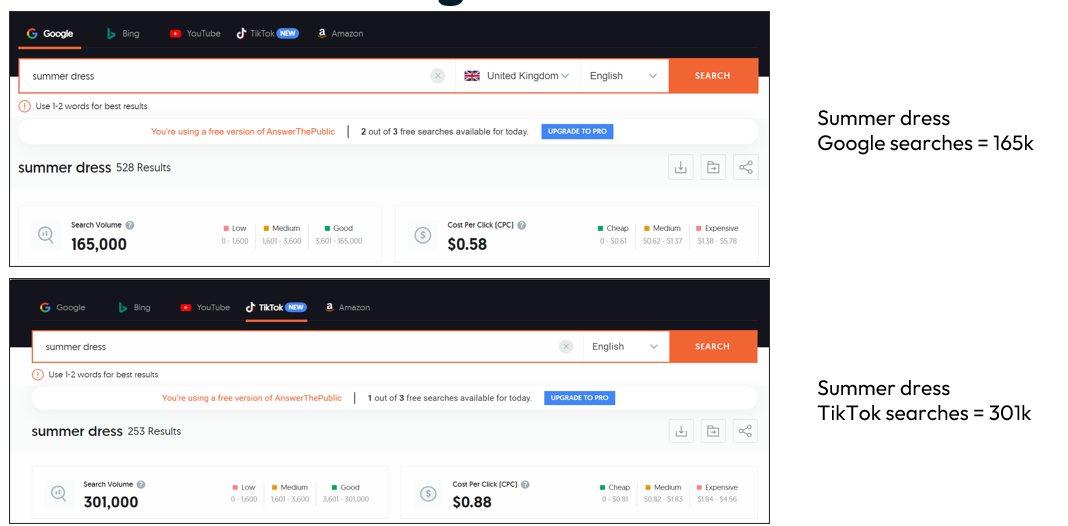
It recently added the ability to get search data from TikTok, so that you can directly compare search volumes across Google, Bing, YouTube, TikTok and Amazon. In the screen grabs below, I have illustrated how search volumes for “Garden furniture” and “Summer dress” differs in Google and TikTok.
a. Garden Furniture – average searches in Google vs TikTok
b. Summer Dresses – average searches in Google vs TikTok
Using TikTok search data for product research and content optimisation
This TikTok search data can help you research how popular your product or service might be on TikTok and what keyphrases you should use to make your content more discoverable on TikTok.
With so many users and buyers on TikTok, this is comparable to merchants that optimise their listings on Amazon or other marketplaces.
In Part II, Ann examines the impact of Generative AI on traditional search.
