As PPC Heroes,
As we kick off series week I thought we would start with a few of my favorite Facebook reports that I find key for optimizing Facebook campaigns and are often underutilized. Facebook lately has been making lots of updates to their ad manager platform and the reporting center. Below I will walk your through how to pull and analyze the Demographic, Placement and Website Conversion reports.
Demographics Reports
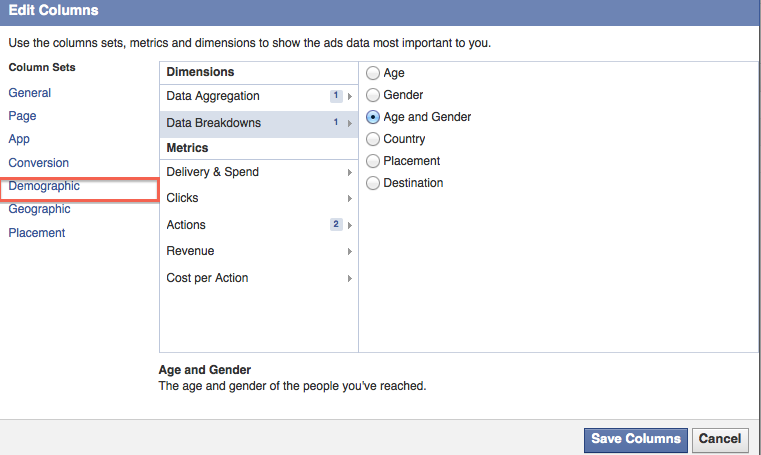
One of the best things about Facebook advertising is the abundance of targeting and demographic options available. You are able to target age, gender, location, interests, ect. The list goes on and on. The demographic report is great because it allows you to drill down even farther into your target audience, and then use that data to optimize your campaigns. You can even use your findings in the demographic report for some of your other PPC campaigns. Below is a quick overview of how to go about pulling a demographic report.

- Pull a General Metrics Report
- Data Aggregation, Drill Down to the Ad Level
- Data Break Downs, Select – Age & Gender *You can only select one Demographic per report
- Select your other key KPIs including – CTR, Cost Per Website Conversion, Frequency, ect.
- Export and Optimize!
I find it helpful to dump the data into excel and pivot the data to make optimizations easier. This is also helpful if you wanted to add another demographic to your report such as Country. Just remember to use calculated formulas to calculate CTR, CpCs, ect.
Website Conversion Report
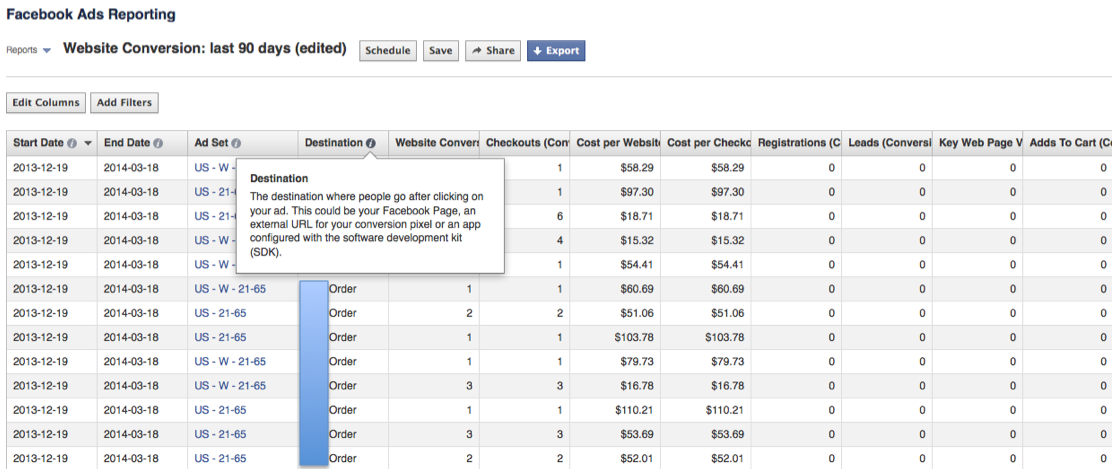
While Facebook advertising is a great tool to boost social engagement with your page, you can now take it a step further and track actions and conversion data. Hallelujah! A PPC lovers favorite word…”conversions”. These reports let you make optimizations based on Website Conversions, Leads, Key Web Page Views, Adds to Cart, Registrations, App Installs and many more. With all that conversion data, you can see which ads are interacting the best with the various conversion options and optimize from there. Export the data, pull out that fancy pivot table again and start to optimize the ads based on Conversion Rate and CPA.
Placement Reports
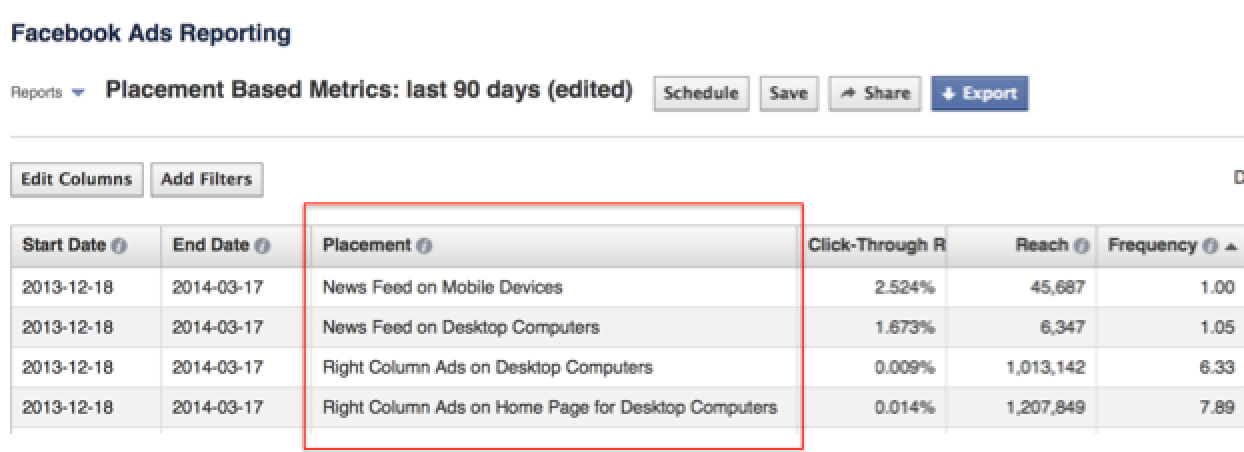
Last, but definitely not least is the placement report. The Facebook Placement report allows you to see where your ads are showing on Facebook and how they are performing. For example, by running the placement report you can see how your ads perform on Newsfeed, right column ads, desktop or mobile. After you select your key KPIs, export the data and look at metrics like CTR, CPA and Frequency.
All of these reports offer a plethora of data at your fingertips that you can export to excel, pivot, and optimize to your hearts desire. Let us know what are some of your favorite ways to use some of the Facebook reports.


