There are numerous software tools that make everyday PPC tasks, such as budgeting, much more efficient and effective. However, many marketers find themselves constrained by budget, or simply don’t spend enough PPC dollars to justify purchasing a tool.
If you find yourself in either scenario, are looking for a better budget pacing method, or are new to PPC, the following tool is easy to set up and will give you the information you need to make budget adjustments throughout the month.
By no means is this the only way to track budgets; there are certainly more robust pacing strategies, but many Hanapinites have found this simple tool to be accurate and dependable for the clients we serve.
Here are the platforms we will use to create the tool:
- Google Sheets (or Excel if preferred)
- SuperMetrics (not required
Step #1: Create the template
For convenient daily refresh and document sharing, I recommend using Google Sheets instead of Excel. Here is a snapshot of what the finished product will look like:

Template steps:
- Starting at the top left, enter what categories you need to track. This may be only one line item, but use this box to segment multiple items (e.g. client list, brands, campaigns, locations, etc.). Then, input budget(s) and create a column for “total spent”, “projected spend”, and “over/under”. We will fill these cells once we have completed the template and created the necessary formulas.

- Next to this box, create boxes for the dates we will use for the formulas (date formulas are listed in the below section). For each month, simply enter the number of days.

- Finally, for each line item you input at the top, create a box with the following columns:
![]()
Now that your template is set up, you can enter the formulas needed to complete the sheet
Step #2: Formulas
Enter the following formulas in the last box you created:
- Projected Spend: Month to yesterday spend + (days left in month x last 7-day average spend).
- The reason I use last 7-day average spend, instead of solely yesterday’s spend, is because spend typically fluctuates from weekdays to weekend days. Taking the average over the last 7 days will account for the different fluctuations.
- Take into account what days of the week end the month. For example, March ended on a weekend, one of my accounts spends $200-$300 less on the weekend days. I needed to bump up my budgets (more than the recommended daily spend) during the last few weekdays in order to account for the drop off in spend during the weekend.
- My suggestion, start with L7D average. If it doesn’t work for your pacing purposes, test out other date ranges until you find what works best.
- Remaining: Budget – MYT Spent
- % Spent: MTY Spent/ Budget
- Pace: %Spent – %Days Spent (see date formula below)
- Rec. Daily Spend: Remaining/ Days left
- Adjust Spend By: Rec. Daily Spend – L7day average
Date Formulas:

In order to use the following formulas, you need to have the first and last day of the month somewhere on your sheet:
- First day of month: =date(year(today()),month(today()),1)
- Last day of month: =eomonth(today(),0)
- Today: =TODAY()
- Yesterday (I8 = “Today” cell): =I8-1
- L7D: =I8-6
- Current Month (I7= first day of month cell) : =TEXT(I7,“MMMM”)
- Days in Month: =VLOOKUP($I$10,$K$8:$L$20,2,)
- The VLOOKUP references the table containing the number of days for each month.
- Days Spent: =TEXT(I8,“d”)
- Days Remaining: =Days in month–Days Spent
- % Days Spent: =Days Spent/Days in month
After you have created the formulas, you can go back to the “Days Left” and “Pace” cells and reference the date formulas you just created:


Step #3: Data Pull
I explain below how to use Supermetrics to pull the data, but if you do not have Supermetrics, you will need to either download the data directly from the advertising platforms (Google Ads, Bing, Quora, FaceBook, etc.) or manually enter month to yesterday cost (MTY) and last 7-day cost.
I recommend pulling the data into your sheet (create a separate tab) and creating a sumif function so that you minimize any manual errors.
Sumif to calculate MTY cost:
=sumifs(Google!D:D,Google!B:B,“*”&$B23&“*”,Google!A:A,“>=”&$I$17,Google!A:A,“<=”&$I$18)

Sumif to calculate L7D average cost:
=(sumifs(Google!D:D,Google!B:B,“*”&$B23&“*”,Google!A:A,“>=”&$I$9,Google!A:A,“<=”&$I$8))/7
This sumif formula references the same data range, but in order to return the L7D average, you will reference the below date formulas.
$I$9 = L7D date formula
$I$8 = Yesterday date formula
Using Supermetrics
I started this blog by describing the reasons you may need to create your own tool. But if you do have the budget, I highly recommend purchasing Supermetrics. It will not only make budgeting easier, but it will also make all sorts of PPC tasks much more efficient. There are affordable pricing options if you are interested in testing out Supermetrics.
For Supermetrics users, simply create a query (in a separate tab) to pull in the data you need to fill in your template:

Use the sumif functions described above to pull the data into the appropriate cells.
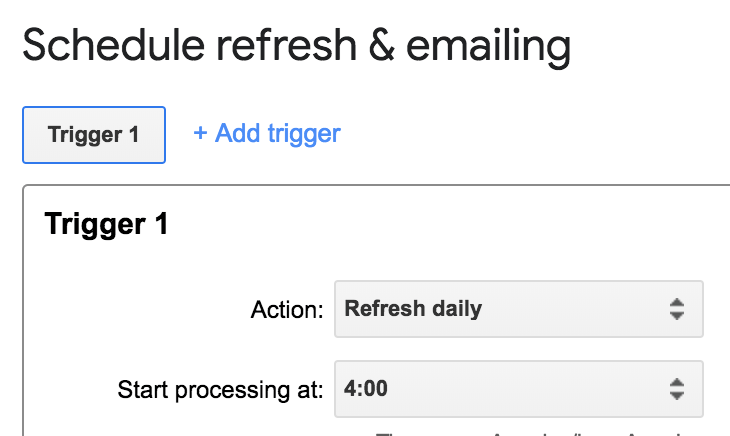
Another bonus of Supermetrics is the option to schedule a daily refresh. Within the Supermetrics bar, toggle to “Schedule refresh & emailing”, then choose the frequency of your refresh and the time at which you want the query to run.


Conclusion
Over or under spending are some of the biggest mistakes we can make as PPCers. Play around with this template and make it your own. I hope it gives you more confidence in your budget pacing decisions. Good luck!


