Google Sheets is a versatile tool for PPC marketers. Whether you’re using it build reports for your clients, analyze data, or other miscellaneous PPC tasks, getting familiar with some of the lesser known functions can be beneficial.
Here are the features we’ll cover in this post:
- Import Sitemaps
- Currency Conversions
- Sparklines
- Import from other workbooks
- Check for 404s and other errors
- Combine data from multiple sheets
1. Import Sitemaps
Function Used
=IMPORTHTML() or IMPORTXML()
Syntax
IMPORTHTML(url, query, index)
- url – The URL of the page to examine, including protocol (e.g. https://).
- The value for url must either be enclosed in quotation marks or be a reference to a cell containing the appropriate text.
- query – Either “list” or “table” depending on what type of structure contains the desired data.
- index – The index, starting at 1, which identifies which table or list as defined in the HTML source should be returned.
- The indices for lists and tables are maintained separately, so there may be both a list and a table with index 1 if both types of elements exist on the HTML page.
But Why?
This function is useful if you’re building out new campaigns for an account.
Examples
For this example, the sitemap is a .xml page, so we’ll need to use the =IMPORTXML function.

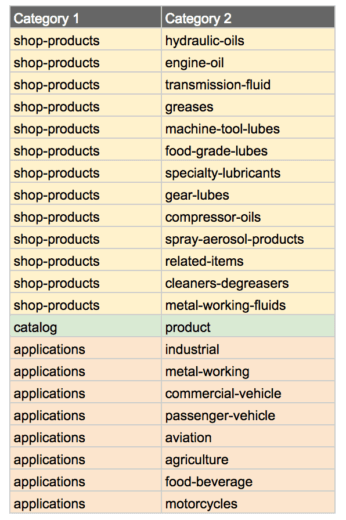
The import function returns the list of URLs on the left, then we use the SPLIT function to break apart the URLs into categories for our campaign structure plan.

2. Currency Conversions
Function Used
But Why?
If you have a client that spends in an international currency, but needs to be converted to USD for billing or reporting purposes.
Examples

In this example the Google AdWords account is set to spend in GBP (£), but we need to report and bill in USD ($). We use the Google Finance function to get the current exchange rate. Then we simply multiply this exchange rate by the spend in GBP to get the equivalent in USD.
3. Sparklines
Function Used
=SPARKLINE()
Syntax
SPARKLINE(data, [options])
- data – The range or array containing the data to plot.
- options – [ OPTIONAL ] – A range or array of optional settings and associated values used to customize the chart.
But Why?
Sometimes you want a small simple graph or bar chart, but don’t want to fuss with creating an actual graph in Google Sheets.
Example
Sheets also does not have some of the conditional formatting that Excel does, so this is a workaround if you want to show bar coloring.


4. Import From Other Sheets
Function Used
=IMPORTRANGE()
Syntax
IMPORTRANGE(spreadsheet_key, range_string)
- spreadsheet_key – The URL of the spreadsheet from where data will be imported.
- The value for spreadsheet_key must either be enclosed in quotation marks or be a reference to a cell containing the URL of a spreadsheet.
- range_string – A string, of the format “[sheet_name!]range” (e.g. “Sheet1!A2:B6” or “A2:B6”) specifying the range to import.
- The sheet_name component of range_string is optional; by default IMPORTRANGE will import from the given range of the first sheet.
- The value for range_string must either be enclosed in quotation marks or be a reference to a cell containing the appropriate text.
But Why?
If you’re working with multiple workbooks in Google Sheets, sometimes it is useful to have a sheet automatically import over to the other workbook.
5. Check for 404s
Function Used
=HTTPResponse()
We need a script to enable this function, see below for script details.
But Why?
If you need to check your landing pages or other URLs for 404s or other errors, this is a simple way to do it. While there are various scripts out there that do this, this allows you to check any URL, as well as other platform landing pages.
Example
For this function to work, you’ll need to implement the script below. To add a script to a Google Sheets file, navigate to Tools > Script editor in the top menu.

Once you get the script set up, you can go ahead and use the formula. At Hanapin we like to pair this with Supermetrics to automatically insert all URLs in an account to check.
Pair that with query functions (my favorite Google Sheet function), and you’ll get a nice report detailing where you’ve got landing pages with errors.

6. Combine Data from Multiple Sheets
Function Used
=QUERY()
But Why?
If you need your data to be easily pivot-able, you’ll need it to be on one sheet. You might have data on separate sheets due to Supermetrics reports (different platforms). At Hanapin, we report client monthly spends on a Google Sheet document. Each month gets its own sheet, but we need to be able to pivot and combine all the months together. The example below shows how we use a query function to do that.
Example
![]()
Simply wrap curly brackets { } around all of the sheets, each separated by a semicolon “ ; “. Then proceed with your query as usual – making sure to include the criteria “Where Col1 is not Null” to leave out any empty rows.
SUMMARY
If you find yourself using Google Sheets frequently in your daily PPC reporting or analysis, it might be worthwhile to try out some of the above functions. I have found that learning and implementing these has helped me step my Sheets game up, even if it’s just for internal reporting.


