Are we seeking out as much volume from paid search as we should be?
Why is cost per click and cost per acquisition increasing?
At what point are we just spending more money for the same number of sales?
Everyone is telling me that competition has increased. Where’s the proof? How do I know you don’t just have a bad bidding strategy?
These are common questions that I hear from prospects and executives. The frustration is palatable and the solution is simple. Auction Insights.
With a couple hours of work you can slice data to tell you at what point you see diminishing returns, who has entered your space and what that has done to your impression share, and if a bad bidding strategy or increased competition has led to raising CPCs.
I prefer to pull a report by the segment I want to review (might be my brand only campaign, a top performing campaign, or account wide, just depends on what I am trying to understand) for at least a 13 month time period (so I can look YoY). I then pull a performance report for that same time with CPC, conversion and spend data. I segment all this data by month and use pivot tables to get all the data in one table. Then it’s chart time!
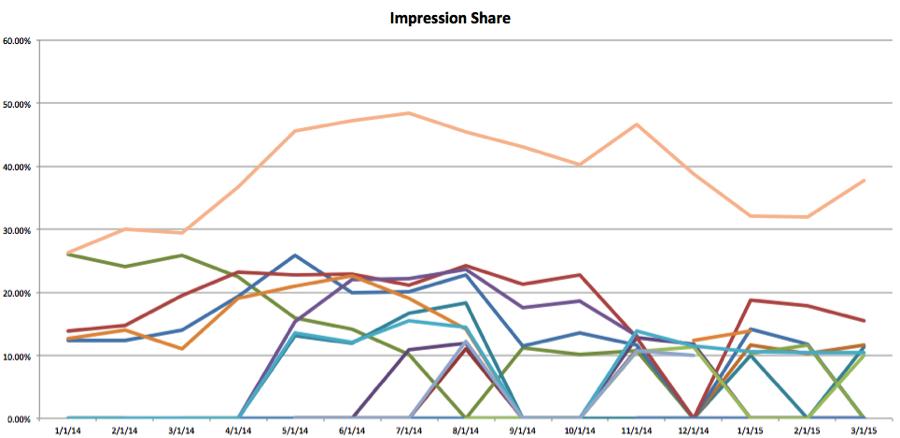
For example, this chart on Impression Share showing that more and more competitors have entered this space and all have seen a declining impression share (it also showed the names of the competitors but I edited that out):
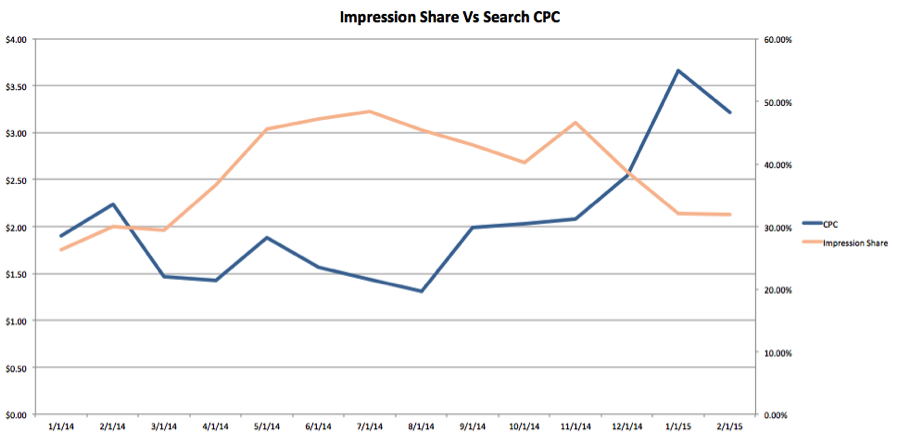
Or there is this report, which shows that as impression share has dropped, and we’ve tried to recapture it, CPC’s have risen. This tells us that it’s not a bad bidding strategy, but rather an increase in competition that has increased CPC.
You can go on and on. You can see how your average position has changed along with lead volume. You can look to see how often others are showing above you compared to your CPC. It all depends on the questions you are trying to answer.
Another added benefit to the Auction Insights report is that it illuminates who your auction competitors are. There is usually a lot of overlap with who a business would say their competitors are, but there is often a lot of other business that aren’t direct competitors but who are driving up your CPC. Having this information can answer questions like, “If the whole industry is down (impressions) then who is bidding up my terms? We all have the same profit margins so it’s not like other folks can afford these high CPCs/CPLs.”
In the end, this data tends to not be actionable, but rather explanative. It helps paint a picture of how competitive forces are impacting your business and the performance of your AdWords account. This data can then inform strategy for budget allocation and help set growth targets based on external forces, not just internal goals.


