Paid search is a dynamic marketplace. Resources fluctuate, competitors come and go, and business goals change. In order to keep up, you must make continual estimations between where you are and where you could be.
While it’s easy to calculate gross differences, it becomes trickier once you must deal with dependencies or analyze multiple scenarios. In this article, we’ll cover What-If analysis through Excel as a way of ameliorating these types of problems.
Scenarios
Scenarios aren’t a full tool in themselves but a convenient way to manage a set of values. Every time you build a model or projection you have to make assumptions. Scenarios can assist you by providing a saved dataset that you can easily toggle between. Rather than manually enter new data, you can create a scenario and implement it when needed.
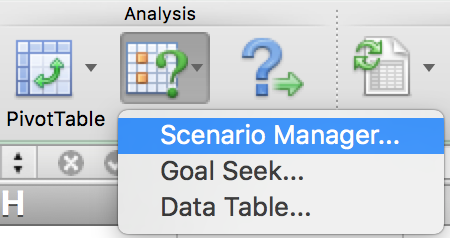
To create scenarios, select “What If” from the data tab and select “Scenario Manager” from the drop-down.
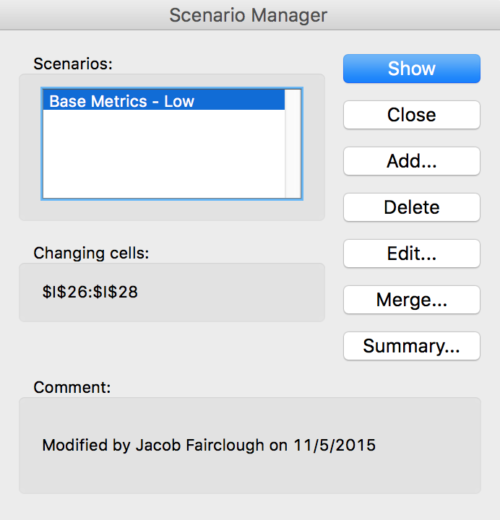
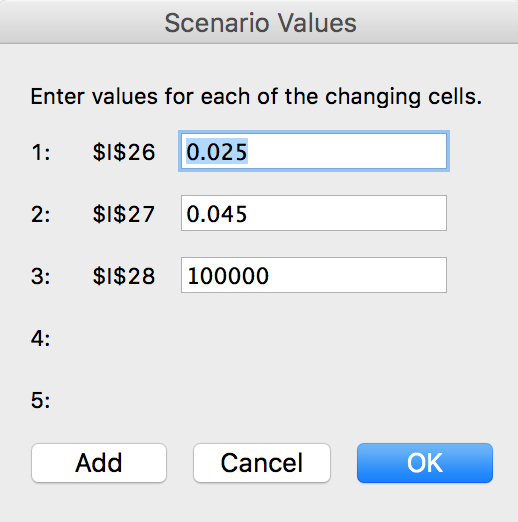
This will open a new window. To add a scenario, click “Add,” give your scenario a name and select your cells. Click OK and enter the new cell values on the next menu.
Create a scenario and select the cells
Enter new values
As you create more scenarios, you’ll see them build up in the left-hand pane. If you’d like to swap between them, highlight a scenario and click “Show.” Be mindful that the cells values are changed. If you need to keep a set of data, I recommend creating a scenario or backing up your original table in another area of the workbook.
Goal Seek
Scenarios help you manipulate data but goal seek allows us to manipulate a value and see the impact on other values. Do you need to see how much higher you must raise your conversion rates to hit 10,000 units sold? Goal seek can do that for you with the press of a button.
To use the tool, go back to “What-If” and select “Goal Seek.”
Enter the cell you would like to change, the value to change it to, and finally you’ll select the cell that need to change the variable cell. Or rephrased more simply, you’ll choose a metric, substitute the desired value, and the secondary metric to change to meet the goal.
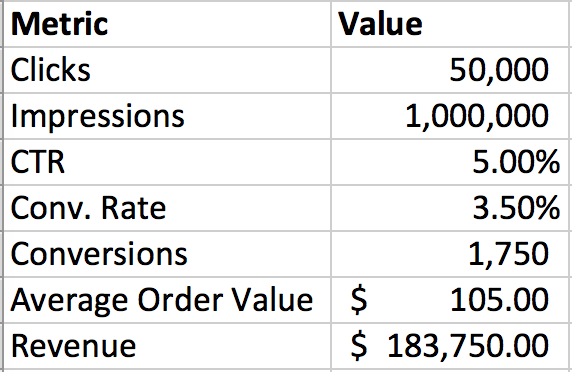
Imagine that you are managing the account and the new goal is set to 2,750 conversions, an additional one thousand conversions. A limited budget is inevitable, so you must find a way to improve your conversion rate to maximize conversions from a similar amount of traffic.
This could be a crazy idea. The downside is you can’t just say, “no, keep dreaming” or you sound like a quitter. And you aren’t a quitter, right? Instead, you get crafty with the goal seek and ask “based on current traffic how much higher does our conversion rate need to go in order to hit this goal?” From there you can see how much of a moon-shot the goal is.
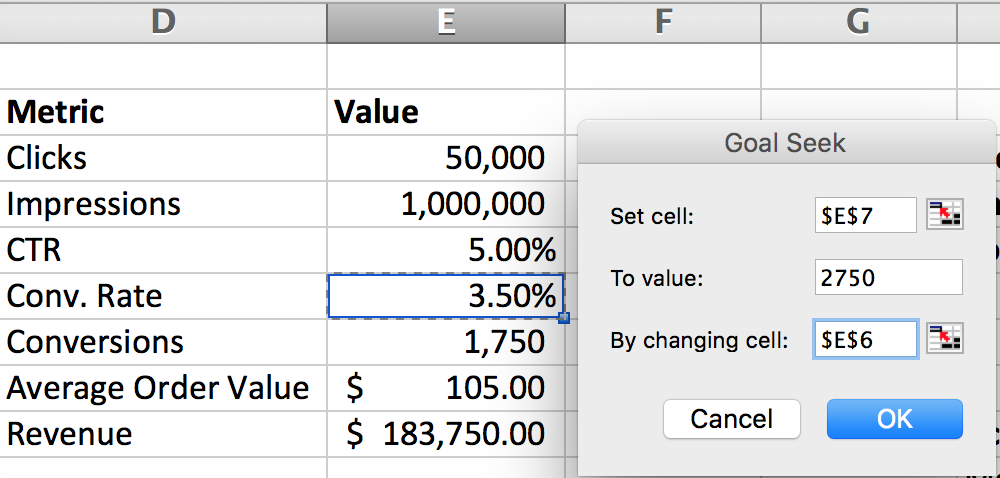
Using the example, we’ll set our conversion target to 2,750 and manipulate the current conversion rate, calculating what it would need to be.
Starting data
Goal Seek Parameters – Set conversions to 2,750 by altering the conversion rate.
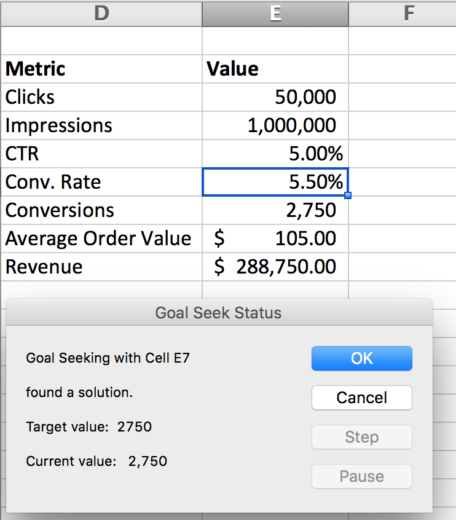
Results
For better or worse, we need to increase our conversion rate to 5.5%, which represents a roughly 57% improvement. That is a big increase, but at least you can now quickly explain what the metrics need to look like to hit the target and adjust accordingly.
Data Tables
As much as I love the goal seek feature it doesn’t help when you have multiple variables. This is where data tables step in. Rather than optimize around two discrete cells, data tables make calculations based on up to two ranges of cells. While you won’t get an exact number like you do from goal seek, you’ll get a range of values than can help with projections and calibrating expectations.
In order to set up the data table, you’ll need to define two variables you’d like to examine. For now, we’ll look at average order value and conversion rate. In this example, you have limited resources and want to find out which has a greater impact on revenue, AOV or conversion rate. Of course, you want both to go up, but is one better than the other?
First we need to collect our metrics. In order to make this work, we’ll need average order value, conversion rate, and clicks. You could use your actual clicks, potential clicks, or a placeholder.
For clarity, I’ll leave the hypothetical numbers in the left-hand side of the image. Next we need to create a table. Since we are comparing the impact of average order value and conversion rate, we’ll use those along the rows and columns. You can use any number you’d like, but these are the numbers that will be used in the calculation so choose wisely.
Now, calculate your total revenue by multiplying clicks, conversions, and average order value and place it in the upper left-hand corner. Double check your formula if needed. It serves as the template for the other cells.
Basic Set-up
Once your table is ready, highlight the entire range, go back to the “What If” tool, and select “Data Tables.”
Highlight the table
Within the menu, you will define with numbers to substitute into your base formula. Since conversion rate spans rows and average order value spans the columns we will use each of them for our reference cells. By selecting these, Excel will then run through the formula again, replacing those numbers with those you’ve placed on the borders of the table.
Setting up the references
Once you’ve set those two fields you are good to go!
Output
You can now quickly assess the revenue to see which option is more feasible. In this case, if you have the choice between moving conversion rate up by 0.5% or increasing average order value by $5.00, you should try to maximize conversion rate. On the other hand if increasing average order value by $10.00 is more realistic than a 0.5% bump to conversion rate, you should go that route as you’ll see more revenue.
Data tables streamline the process, compared to relying strictly on formulas. There is no need to worry about cell references as you drag formulas and the tables dynamic nature allows you the flexibility to tweak your rows and columns. In fact, you might even opt to use a scenario to swap between different values – perhaps switching conversion rate to 0.25% intervals.
Let’s do another quick example but skip the setup. This time, we’ll try and answer the question, will you see more conversions by increasing the conversion rate or increasing you CTR? The conversion rate helps with existing traffic while CTR brings more visitors to the site (assuming the same number of impressions).
In this example, a +0.25% change CTR is going to have a larger impact than a similar increase in conversion rate, providing us 11 additional conversions at 2.75% CTR but only 6 additional conversions if we bump up to a 4.75% conversion rate.
Of course we are back to the question of “why not use a formula?” or “why not use goal seek?” While these features would help us calculate the changes, the data table gives use access to both metrics at once. This can be vital information because rates don’t always stay the same. An increase in CTR can mean you acquire slightly less profitable traffic and conversion rate drops. The data table can help you build that scenario.
In this instance, if we can get our CTR up to 3.00% we will see improvements in conversions regardless of conversion rate changes – at least those above 4.00%. Of course, if this was a real scenario, you’d have to factor in the additional costs for clicks and the value of a conversion, but this is a solid starting point.
Conclusion
We’ve only scratched the surface of the What If functionality. There are plenty more scenarios for which you can use these tools. For example, you could use the data tables to plot the changes in performance as Avg. CPCs and top of page rate changes. Or you could build a complex set of graphs and projections and use scenarios to fill in a plethora different market situations, all with the click of a button.
If you’d like to expand your toolset further, check out the Solver tool. Solver is a free plugin for excel that optimizes around one or many parameters. If you’d like to see it in action check out a relevant and helpful PPC Hero post on using the tool to optimize daily campaign budgets.


