Between reporting, analysis, dashboards, and action item lists, we use Excel a lot for PPC. Recently, our team has begun to rely on Google Sheets for items like reporting, dashboards, and even to-do lists and status docs. We’ll go through how to get your data into Google Sheets and how to manipulate it once it’s there.
Supermetrics
Want an easy way to get all your PPC data into a Google Sheet? Supermetrics may be your answer!
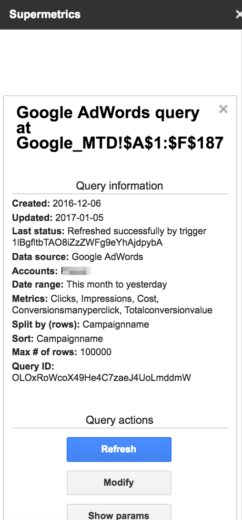
After installing the Supermetrics add-on, simply click to open the side bar. Then select which platform, account, and metrics you’d like to pull in. Once you create your query, you’ll see an overview that looks like this:

You also have the ability to schedule automatic refresh and emailing so you don’t have to worry about going in and manually telling it to refresh. Also note that you can select multiple accounts, ideal for running reports for clients who have many accounts.
Now you’re probably wondering “cool so I have all the data in Google Sheets….now what?”
Build Dashboards
Once your data is where it needs to be, building nice dashboards requires some simple IF formulas.

Helpful tip: use the below formula to automatically change the month start and end dates

Build Reports
For some clients, weekly reporting is a grueling and time-consuming task. Especially for reports that are manual in nature, and automated platforms such as Acquisio or Ninjacat cannot be used.
In this instance, the client has over 20 brands, each with their own accounts on four platforms. They need their reporting in a very specific format, one that requires a lot of manual number-pulling. Enter Google Sheets.

With the data sheets automatically updating daily with weekly and month-to-date numbers, we set up the “Weekly Report” sheet to automatically calculate metrics like spend, conversions, CPA, and projected spend. We use a SUMIF formula to sum up metrics based on the campaign name (note: in this case, it’s important to have a consistent naming convention across all campaigns and platforms!).
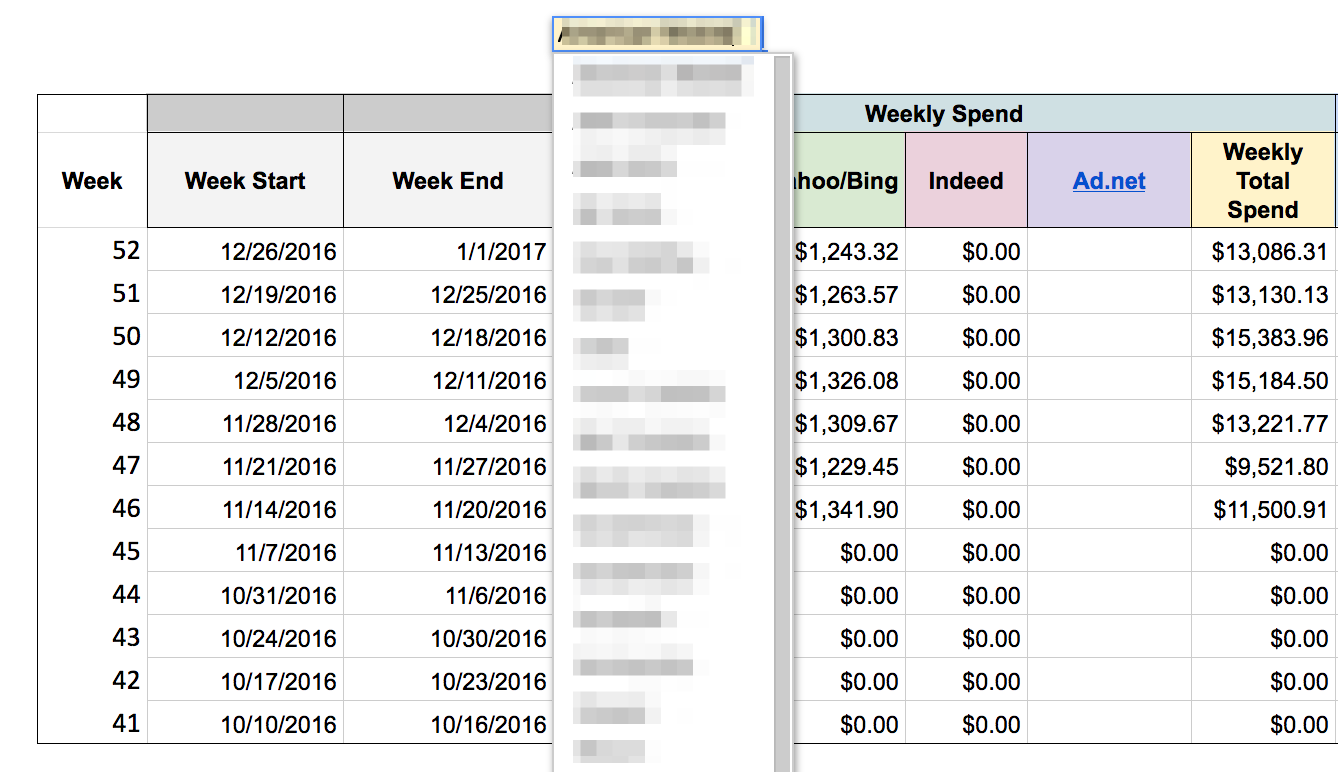
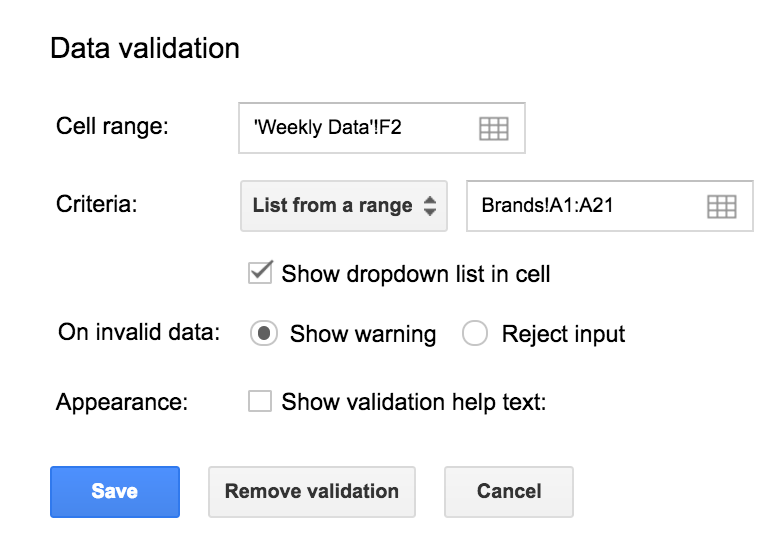
On another sheet, we want to be able to quickly see the weekly performance by brand. To accomplish this, we create a dropdown menu using Data Validation:


The formulas in this sheet reference the drop-down cell to automatically generate the data, using SUMIFS to match with the campaign name, and the week number.
Integration With Google Data Studio & Other Reporting Platforms
While Google Data Studio might be a great reporting option for some accounts, it doesn’t connect to Bing, Facebook, etc. However, there is a pretty simple workaround using Google Sheets.
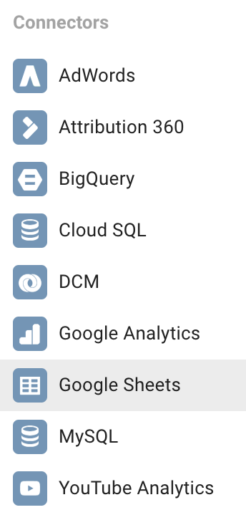
Simply select which type of item you’d like to add to your report (table, scorecard, graph, etc.) then click “create new data source”

After you select Google Sheets you’ll be prompted to select which sheet you’d like to use. Data Studio will then automatically import the dimensions and metrics. Easy!
Note: if you’re using date selectors in your Data Studio reports, you won’t be able to use these on data pulled from Google sheets. Label your charts appropriately.
Link Two Sheets Together
Say you’ve got some complicated reporting for a big client. You’ve got part of the report all set up in one Sheet, but need it to be easily accessible in another. This is where =IMPORTRANGE() comes in handy.
The first component of the Import Range formula is the spreadsheet key. Find this value in the URL of the Sheet between /d/ and /edit#. Make sure you put quotes around this, or else you’ll end up with a nice error.
The second component is the range you’d like to import. Format it like this: “Sheet Name!A1:B26”
The data will refresh in the new sheet automatically when the original updates. Pair this with scheduled Supermetrics reports, and you’ve got yourself a nifty automated report.
Using Query Functions
Query functions are massively versatile and can take the place of several other formulas. Say you want an automatically generated list of all the converting keywords in your report.

By writing a simple query function, we’re telling Google Sheets to return everything where column J (total conversion value) is not equal to 0. We also only want to return the top 8 keywords. Instead of writing a formula for every column we want to include, we just write one. Magic!
The one thing to note is that query functions are not compatible with Excel. Bummer, I know. When you export this file into Excel you’ll get something like this:
![]()
Status Docs
Status docs are a great way to organize to-do list and notes. Whether you’re using it just for yourself, to share with colleagues, or to share with a client, it’s important to stay organized.
A shared document on the Google Drive is a great way to keep things up to date. Check off action items as you’re doing them so your client doesn’t have to fill your inbox asking for status updates.

Closing Thoughts
For clients that require special reporting, Google Sheets paired up with Supermetrics might be a great choice. While we all love the automated reporting that some platforms provide, sometimes they can be limiting in their abilities.
Google Sheets has some great functionality with query functions and the ease of sharing that make it a great productivity tool. What do you use Google Sheets for?


