In agency life, you most likely manage multiple accounts. So how do you identify which of those accounts need optimizations in a quick and convenient way? Well, lucky for us Bing Ads has added fuller reporting features to the Accounts Summary page. In addition to providing more performance insight across each of the Bing accounts you manage, you’ll also be able to more swiftly answer questions such as the following.
Which accounts increased or decreased in clicks week over week?
Go for it. Compare performance between two time periods! This will help you allocate budget across shared accounts or let know which accounts you need to pay more attention to this week.
In Bing, it is now just a little bit simpler to understand how your accounts performed between two periods of time, which can provide additional context to fluctuations in clicks, impressions, and other performance metrics.
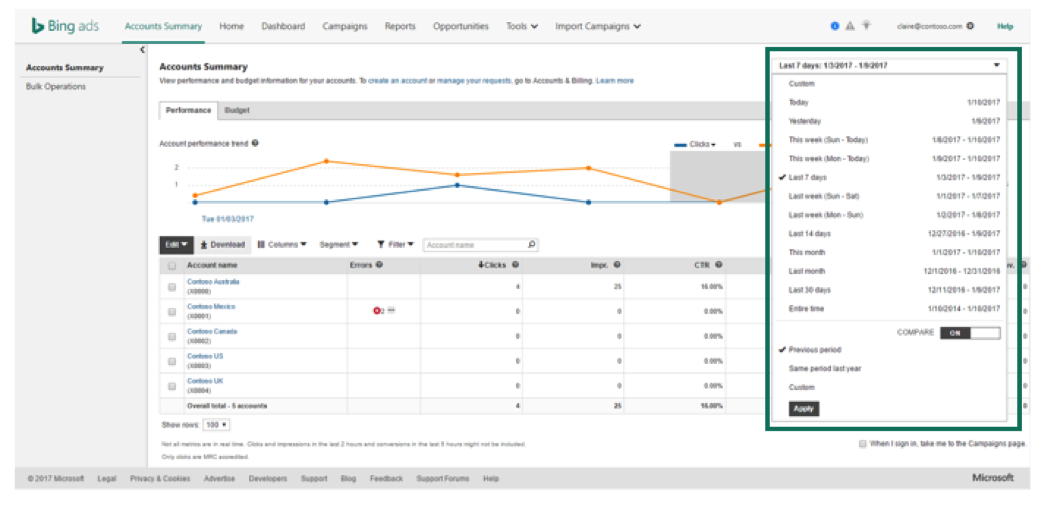
Open the date range selector and turn on Compare. Select a time period, such as 7 days, and Apply any of the following options:
- Previous period: If the current time range selected is this month (e.g. 12/1-12/31), then the previous period would be last month (e.g. 11/1-11/30).
- Same period last year: If the current time range selected is this month (e.g. 12/1/16 – 12/31/16), then same period last year would be this month last year (e.g. 12/1/15 – 12/31/15).
- Custom: Any length of time within 3 years before today can be selected as a comparison period.

From there every performance metric in the table can be expanded by clicking the ‘+’ icon. You will then see 4 sub-columns under every performance metric for deeper analysis into:
- Performance from your current period
- Performance from your comparison period
- Change (Current Performance – Comparison Performance)
- Change % ((Current – Comparison)/Comparison * 100%)
You’ll be able to see this data for any segment you’ve applied to your table, and you can filter on these sub-columns. For example, you might choose to isolate the accounts that saw a 10% decrease in impressions to focus your optimization efforts that day. You can see these sub-columns in your downloaded file as well.
How are each of my accounts doing across devises?
It is time to segment that data! This process allows you to quickly edit device bid adjustments.
Segmentation allows you to slice and dice your data, right in the campaigns grids. You’ll be able to see how your accounts are performing by network, device, ad positions, or time segments.
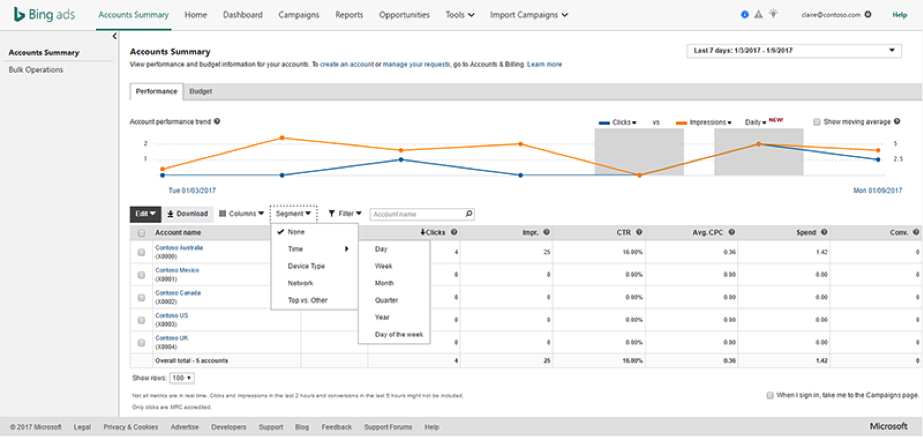
Click Segment in the toolbar above the table, and then the segment you’re interested in, shown in the image below.

The following segments are available for analysis:
- Time (Day, Week, Month, Quarter, Year, or Day of the Week)
- Network (Bing & Yahoo, AOL, Syndicated Search Partners)
- Device Type (PC, Smartphone, Tablet)
- Top vs. Other (Mainline vs. Sidebar ads)

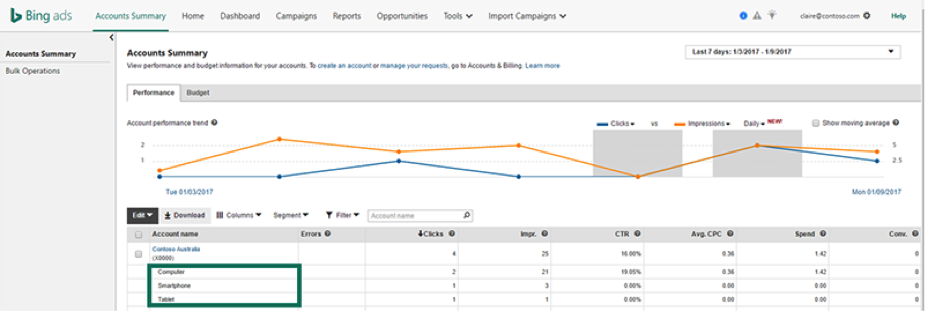
The segment you select will automatically be applied to the performance metrics expressed in the table, with each account’s performance displayed by the segment, as shown in the example by Device Type below.
This data can also be downloaded so you can do further organization or share your findings with clients and teammates.
How does my overall performance across all accounts look over time?
Go ahead, visualize that performance! If you have multiple accounts under one client, this would be a great resource to have open during a regularly scheduled call in order to answer YoY or performance questions quickly.
The line chart above the table helps you visualize your performance across all accounts and detect patterns or anomalies quickly. Perfect for clients who respond better to visuals.
You can compare, up to two performance metrics, much like Google AdWords. Choose from the following metrics: Avg. CPC, Clicks, CPA, Conversions, CTR, Impressions, Spend, Avg. Pos., Conversion Rate, Revenue, and ROAS. When period comparison is turned on, the performance of the compared-to time period will be in a lighter shade. You can hover over each point on the line graph to see the exact numerical value of that performance metric at that time. Any filters you apply to the table will also be applied to the line chart.

What CPAs am I seeing across each of my accounts?
All the things – find even more metrics to analyze. Helpful for quick call references and larger reporting needs.
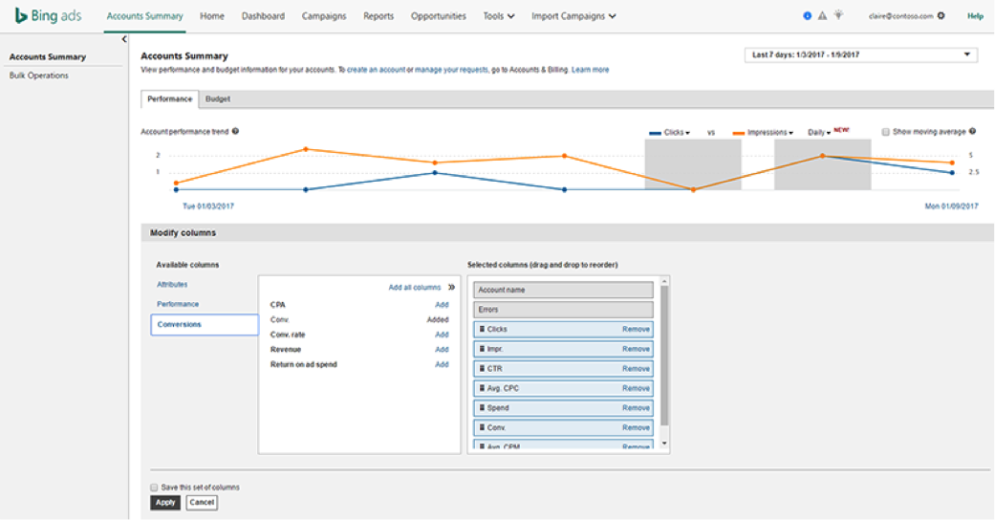
With the column chooser, you can select additional data points to examine, including:
- Avg. Position
- Quality Score
- Avg. CPM
- CPA
- Conv. Rate
- Revenue
- ROAS

Very similar to earlier shown examples, these additional metrics can also be compared between time periods, as well as segmented, filtered, and downloaded.
Now that you know all of these newfound Bing Ads reporting features in accounts summary, you can tackle your accounts and your week ahead like a pro. You go girl.


