With yesterday’s webinar on efficient data analysis through Google Sheets, as well as Tuesday’s post pitting Excel features in their very own March Madness tournament, this week on PPC Hero we’ve highlighted one of the most important pieces of the digital marketer’s toolbox: spreadsheets! Today, we’ll continue the trend by showcasing an application of Google Sheets, utilizing some of the techniques discussed in the aforementioned webinar to solve a problem in a way that saves time while revealing actionable insights. Whether you find the methods here translatable to your own work, hopefully such an example will inspire you to consider creative approaches to various challenges and build new tools customized to make your life easier.
The Problem
While managing PPC accounts for yourself, an internal team, or a client, one aspect you’re sure to face is working within a budget and managing spend across channels, initiatives, and many other possible dimensions. For some, this can be a stressful part of the job—especially if there are multiple areas to allocate resources or if frequent budget or traffic changes demand regular spend pacing evaluation. We may quickly find ourselves repeatedly performing the same tasks if such is the case, measuring all our advertising spend in the given time frame, checking against budgets, identifying problem areas, calculating projections, and implementing changes to remain on target. Even if much of this information is contained in, say, a weekly report, the date range of the report may render the data inconvenient or obsolete. What should you do, for instance, if you seek to make budget adjustments at the end of the week based on current monthly spend, but your most recent report only covers through the previous week?
After encountering similar situations in some of the accounts we work with, we decided to create a spend tracker tool in Google Sheets. We designed it so it would automatically pull in all necessary spend data daily, aggregating, organizing, and calculating the information so all that would be required was to view the document, make decisions based on what it presented, and feel relief at the manual labor it had already completed. What made us choose Google Sheets for the task? Despite it being a natural pick after utilizing it to communicate and work with some of our clients, there is an array of other benefits (some outlined in the aforementioned webinar) including:
- Expected Excel/spreadsheet functionality (e.g. functions, tools, charts)
- Easily shareable with colleagues and clients for real-time collaboration
- Ability to import data from other documents with changes instantly synchronized
- Customizable with your own creativity compared with other tools
- Add-ons and scripts allowing for expanded possibilities
- Low cost (free to use Google Sheets, although some add-ons require fees)
Without further ado, let’s dive into how we created the tool!
Step 1: List your budgets (and know your budgeting timeframe)
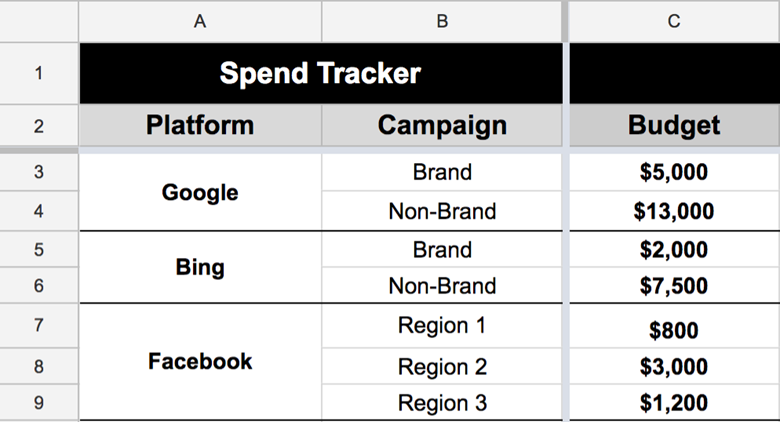
In general, your budgets dictate how you organize spend and thus how you will structure your spend tracker. Keeping in mind each account is rather unique in its arrangement and budgeting, in this exercise we’ll build upon a simple example to illustrate the setup. Let’s suppose you have accounts across Google, Bing, and Facebook, with separate budgets for brand and non-brand search campaigns as well as for three different regions targeted in the social campaigns. After creating columns in your spreadsheet for your campaign groups and their budgets, your spend tracker may initially look like the following:

We’ll assume the budgets listed in column C are monthly numbers in this walkthrough; however, the above construction can work for budgets of different timeframes (e.g. quarterly) provided you’re cognizant of your range when building. We can choose to update the budgets manually as needed, but if your budgets already exist in another Google Sheet – within a planning document shared by the client, perhaps – you can make use of the IMPORTRANGE function to automatically fetch this information. The advantage of this is that any updates made within such a spreadsheet will be directly transferred to the spend tracker, eliminating inconsistencies that could develop with manual changes.
There are several ways to handle data import using IMPORTRANGE, with merely one possibility depicted below. If, for instance, the budget for the Google brand campaigns is contained in cell K15 of a “Q1 2017 Budgets” tab within a different Google Sheet, the corresponding spend tracker cell could be modified to read:

Step 2: Integrate your spend data
Our next task is to pull in spend information for our given timeframe so we can see how it stacks up with budget every time we check the tracker. This step benefits greatly from an add-on such as Supermetrics which allows you to directly pull data from your marketing platforms into Google Sheets, as it will streamline the process and pave the way for easier automation. However, if you don’t have access to such a tool, we’ll outline how you can achieve the same goal with a more manual method.
Our logic is to create a new tab within our spreadsheet that houses all the campaign spend data for each respective platform, where we’ll then filter and aggregate the data using formulas in the main tracking tab. After introducing these in our example, the document tab bar looks something like this:
![]()
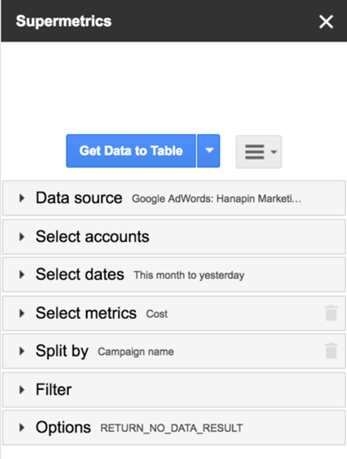
Let’s suppose for a moment we’re using Supermetrics to assist in our build – to acquire the most recent Google spend for the budgeting timeframe (in our case the current month), we could write a small query as follows to populate the “Google – All Campaigns” tab…

…which will transform the tab into a similar appearance after running the query:

What if you don’t have an add-on tool like Supermetrics? You’re not out of luck – observe we can mimic the same result by downloading a customized spend-only campaign report directly from the platform and simply pasting the results in the same location. While it may not be the optimal solution involving more manual work, it still allows you to reap the benefits of the tracking tool and keeps avenues open where add-ons may be currently lacking coverage. Alternatively, if you are proficient with coding or desire to develop your skill, you can write your own scripts to integrate needed information and grant yourself maximum control.
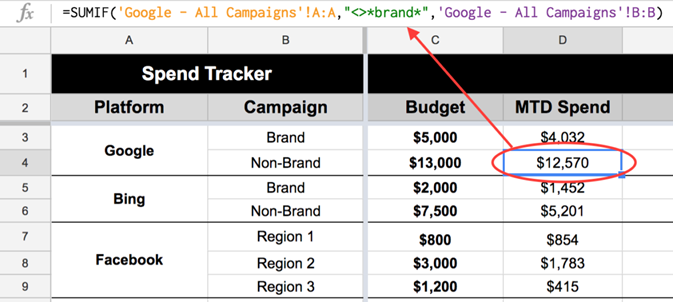
Now that we have our spend numbers in place, we need to connect them back to our tracking tab. We’ll make use of the SUMIF function (SUMIFS if you want to filter multiple conditions) to consolidate the data in the proper cells, although you could use the QUERY function if you want to take advantage of the Google Visualization API Query Language in Google Sheets. Here are the functions we’ll use to report on the Google brand and non-brand campaign spend, respectively, for the month:


Incorporating these functions in the matching locations will cause our tracker to look like the following:

Step 3: Automatically update your data
We’ve successfully acquired our spend numbers, but you may have noticed we’ll need to continually re-run the queries or input new versions of the data to maintain an accurate portrayal of our spend as the month progresses. With Supermetrics, we can make this task much easier by scheduling an automatic refresh of our queries. The option resides under the Supermetrics menu in the document’s Add-ons drop-down.

By setting the queries to refresh each morning, we’ll be able to view the tracker every day and have the most recent information ready as soon as we arrive. This is what transforms the spend tracker into a truly useful time-saving tool — most maintenance work revolves around updating the structure as needed rather than pulling and calculating data, liberating more time for valuable analysis.
If you’re relying on manually pasting in your information, you’re unfortunately limited in the automation discussed in this step. By no means does this render the tool useless to you – the setup will still accomplish a great deal of legwork, and you can simply choose to update the data at your convenience.
Step 4: Add in the bells and whistles
We’ve got the core functionality of the spend tracker mostly established, so all that’s left is to make it more robust with extra features. Here is where you can diverge and customize according to your needs, but we’ll cover just a couple of the numerous possibilities for bolstering what already exist.
Budget Remaining and Percentage Spent
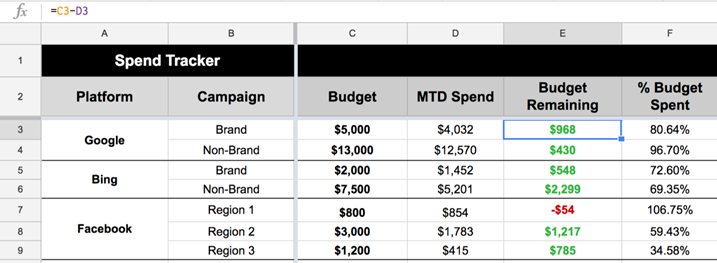
All right, so perhaps these are a necessity – after all, what good would it do to simply look at budgets and spend with no way to compare them? We’ll add two columns to automatically calculate how much budget we have left and a percentage of what we’ve used. The formulas for these are straightforward: (Budget – Spend) for the first and (Spend / Budget) for the second. Here’s what our spend tracker looks like after the change:

Pacing
Say you have questions about how spend is pacing through the budgeting timeframe – for example, is money being used up too quickly or moving too slowly? What on average should you be spending per day to achieve your target goal? To answer these inquiries, we first need a way to track our position relative to the whole time period. With the monthly budgets in our case, this entails knowing today’s date, how many days total belong in the current month, and how many days remain.
Fortunately, Google Sheets (and Excel) have a slew of built-in functions related to time, so it’s quick to fill out a few cells with the needed information that we can reference throughout the document. The cells and their method of calculation are depicted below, utilizing combinations of the TODAY, EOMONTH, and DAY formulas.

These three dynamically updating pieces of information create several new opportunities for analyzing pacing and addressing the above questions. For example, we can determine what percentage of the month has passed by calculating (Yesterday’s date / number of days in month), then compare this with the portion of budget spent we computed earlier to see how the two numbers align. Furthermore, we can figure out the average amount we’d need to spend each day to meet goals by applying (Budget remaining / number of days remaining), allowing us to adjust current trends accordingly.
This provides us several new additions to our spend tracker so far, which has grown significantly since its humble beginnings:

Wrapping Up
There are countless areas you could continue expanding beyond the ideas discussed above; the value of building our spend tracker in Google Sheets is the freedom to modify and tailor the solution to best match your needs and the demands of the account you’re working with.
Perhaps while progressing through the above guide you thought of ways you would do things differently or other potential applications of the tools presented. If that’s the case, then we’d love to hear your thoughts and ideas! The intention behind discussing this particular application was to showcase how we approached a toolbox of possibilities – in this case, Google Sheets – and our thought process in utilizing it to build something that benefits the work we perform. It’s our hope that by doing so, we fostered a sense of imagination and exploration that inspires others to consider what they, too, can create with the sandbox around them.


