Last week, Hanapin Marketing conducted its monthly, company-wide training session where we take a look at a variety of PPC topics to further our understanding and develop as a company. For this session, one of the topics we covered was taking revenue across Adwords and Analytics, and I wanted to share a bit of what we presented with our readers.
Overview
For starters, if you aren’t tracking conversions in Adwords, or goals in Google Analytics check out these helpful tips from Jen to get you started on the right path. Adwords has multiple conversion types to choose from, including: purchases, sales, sign-ups, views of a page, and other. In addition, if you link your Google Analytics account to Adwords, you can import goal conversions so you don’t have to tag your conversion pages with the Adwords code. Please note that when you do link these accounts, your data in Analytics and Adwords won’t match up.
Adwords tracks the “first touch” while Analytics tracks the “last touch”. This means that the keyword that triggered your ad the first time a user visits gets the credit, even if they come back and convert with a different keyword later. When a user visits your site via one search query, Google leaves a cookie to track that visitor for the next 30 days. Now, from the Analytics point of view, when a user converts, Analytics records the last keyword that user searched and converted on, rather than the first keyword Analytics reports and then tracks users with a 6 month cookie.
When you download your reports from Adwords, it’s important to look at both one-per-click and many–per-click. A lot of times, it’s easy to ignore what your many-per-click column is telling you. However, this data comes from whenever any of your conversion scripts run within the 30 days after the initial ad click.
Utilizing Analytics to Increase Your Revenue
Google Analytics provides a ridiculously wonderful amount of information, and if you’re not using it to its full potential, you could really be missing out!
- A valuable metric for ecommerce accounts is cost per visit. You can compare this metric to your Adwords CPC to make sure that your account is profitable. Cost per visit is calculated by an average of how much revenue a keyword brought in versus how many visitors it received.
- Look at revenue from organic traffic for missed opportunities. It might be beneficial to advertise on those networks too.
- What products are generating revenue? You might consider breaking these products out into their own campaigns so that you can monitor their budgets separately.
- Look at the organic keywords generating revenue for missed opportunities.
- Take a look at your day parting information. You can break down the days into hours to allocate your budget the right way during peaks and lows.
- What are your keyword positions telling you? If you go to Traffic Sources in Analytics and drill down to Keyword Positions, you can see how much revenue a term generated in various positions. I’ve seen several instances where it’s more profitable to be in say, positions 3-5 rather than the top spot.
- Take a look at what countries your sales are coming from so you can make decisions on expansion and restrictions.
Getting an Accurate View of Revenue v. Cost with Excel
As I explained earlier, your Adwords and Google Analytics data won’t match up. There’s no reason not to put in a bit of effort and pull out your data in excel to review it all side by side. A few months back, Amy had a great instructional post for how to perform a VLOOKUP in Excel to review your historical stats. You can also use this handy function to pull out your cost data from Adwords with your revenue data in Google Analytics to calculate ROI and profit loss.
Here is an overview of how to do this, but for more detailed information on VLOOKUP and Concatenate check out Amy’s article referenced above.
- Download the necessary keyword data from Adwords into an Excel workbook – pay attention the time frame you use so that you can pull matching data from Analytics.
- In Analytics, go to Traffic Sources > Adwords > Keywords. (Accounts have to be linked). Select the same time frame as what you downloaded in Adwords
- Click on the Ecommerce tab to bring up the revenue column
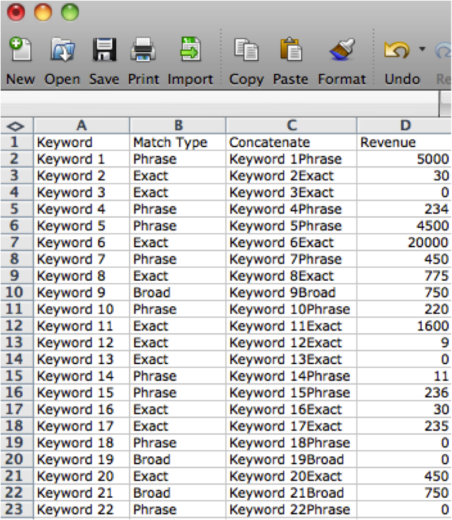
- In the keyword column, click the second drop down menu and select match type (see screen shot below for help) You’ll need the match type info to concatenate your columns later
- Download this keyword data into a second sheet in the same Excel workbook
- From here, you want to pull your cost information in Adwords into the Analytics sheet so that it matches up with the correct search term
- In both sheets, you’ll want to concatenate the keyword and match type. This simply combines the information so you can pull it from the other sheet. To do this create a new column and put the formula =CONCATENATE(cell,cell)
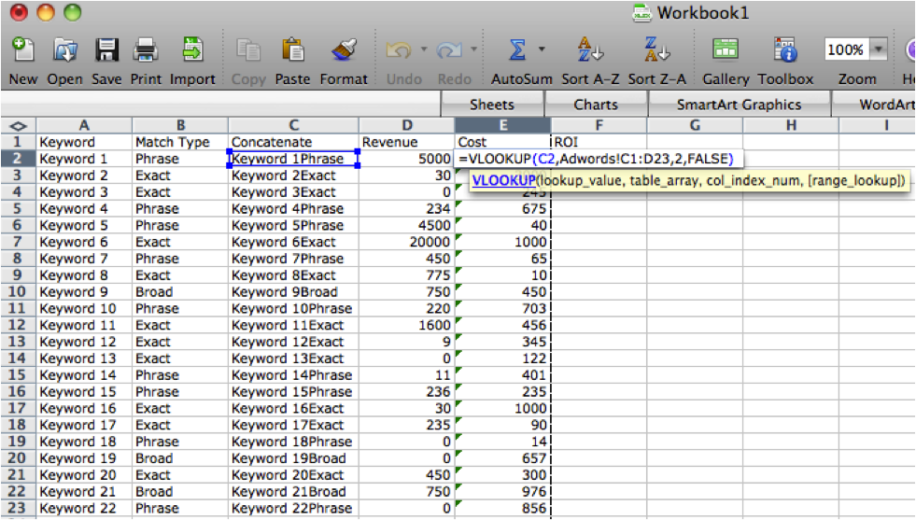
- Then go to the Analytics sheet in your workbook and create another column called “Cost” to put the VLookup function in.
- When done correctly (Vlookup is tricky until you get used to it, but it’s totally worth it) you’ll be able to see your costs and revenues right next to each other.
- Now, create yet another column next to your VLookup for calculating ROI which is (Revenue-Investment)/Investment x 100.
- Okay, last column, scout’s honor… You can also calculate your profit loss by subtracting cost from revenue
Wait! So what do I do with this information? Well, from here, you’ll be able to see which keywords you’re throwing a lot of money at for very little result, or which keywords are genuine rockstars. This process should highlight areas where you should be spending less money (or pausing entirely) and keyword areas that could be broken out into their own campaigns.
There are a lot of ways to review your revenue v. cost on Google, and it’s a very important aspect of PPC to understand, as everything we do has to have some sort of payoff. Leave your sales/revenue tips and comments below!


