Welcome to the Google Analytics Test Lab! If you are just setting foot in the Analytics Lab for the first time, this is the place to start. To kick off our series this month, I will take you through your lab’s set up with the top ten areas to gather the best info for your experiment. Google Analytics can be a very powerful tool for Internet marketers – use it wisely!
Lab Coats On, Safety “Googles” Ready: Getting Started
Once you have an Analytics account set up, you need to install the Analytics Tracking Code on each page of your site. If your site uses templates to generate pages, you may only have to place the code once. Here is how to find and implement your snippet of code:
- Click the Admin tab and check that the URL in Analytics matches your site’s URL
- Click the Tracking Code tab to the right of the Profiles tab – Choose Standard or Advanced (useful if you have a mobile site in addition to your regular site)
- Copy the snippet of code in the box at the bottom of the page
- Paste the snippet into your web page just before the closing </head> tag
- Verify that you have the right web profile ID in the snippet so that the information is flowing to and from the correct places!
- Start gathering useful data!
Creating Your Hypothesis & Research: Tools To Monitor Your Data
Where to Look: the Home Page tab
1. The Dashboard
When you log into Analytics, you will be directed to the Dashboard, which is an overall snapshot of your site and how it’s performing. You can easily customize the dashboard to see statistics that you find most meaningful. In the world of PPC, a great piece of information to have on the Dashboard is goal conversion data. Click here to learn more about creating your personal Dashboards.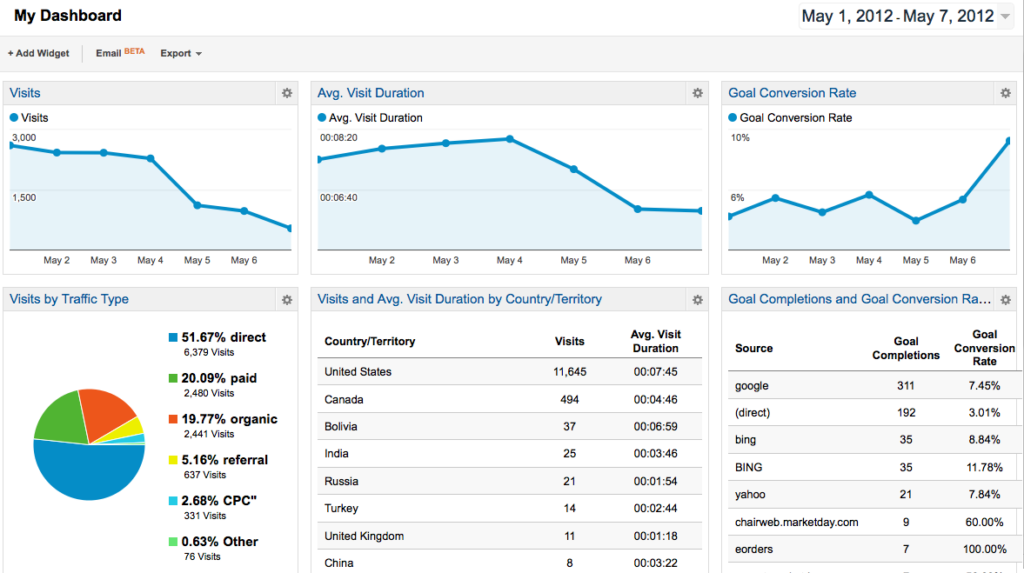
2. Analytics Intelligence
It feels like inside information for sure. The Intelligence area of Analytics monitors your website for and significant variations and then generates alerts when those items occur. Automatic alerts will be generated when there are major changes in traffic patterns on the site and are created with historical data in mind. Custom alerts are created by you and let you know if specific conditions in the account are or are not being met. For example, if you need to know when conversion goals are decreasing by a certain percentage in a specific geo targeted area, Analytics will alert you. Since everyone loves to watch a video, check out this one! 
3. Real-Time Metrics
This is like watching your lab experiment bubble right along… This segment will show you visitor activity seconds after it happens on your site. See which campaigns are working well after their initial launch, which pages are being hit and how long people are staying on them. Did you just post a blog? See in real-time what affect that and other social engagements might have on the site. Yes, you can read all of the reports and get the majority of this information, but why not watch it live and get immediate feedback!? 
Bunsen Burners Off: Tools for Analyzing Your Data
Where to Look: the Standard Reporting tab
4. Audience Reports
This segment of Analytics will help you better understand who makes up your site’s audience by location, language and other custom variables. It also provides information on which channel they access your site on, what their behavior is while on the site and what their response is to the site via social mediums. Understanding these different segments can help better target your PPC campaigns as well as create better pages for your website to improve the user experience. Find out how to use custom variables in the Audience area to expand your scope by clicking here!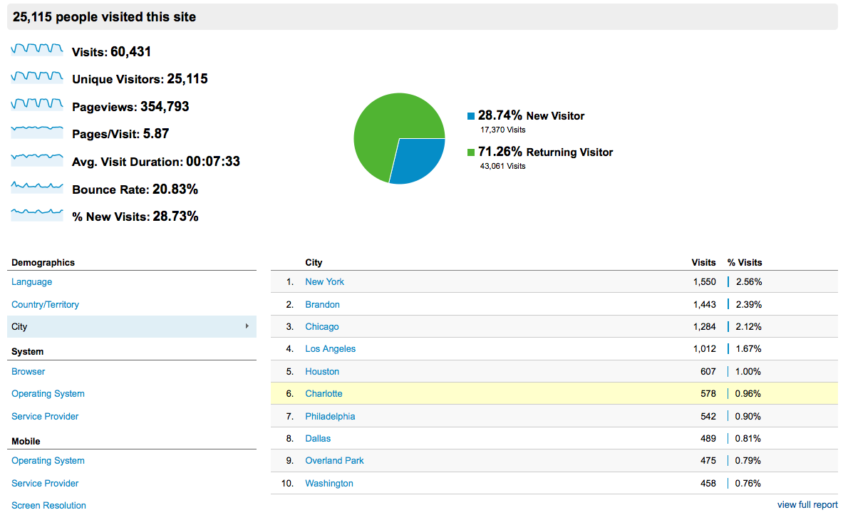
5. Advertising – Analytics’ Secret Ingredient for PPC Success
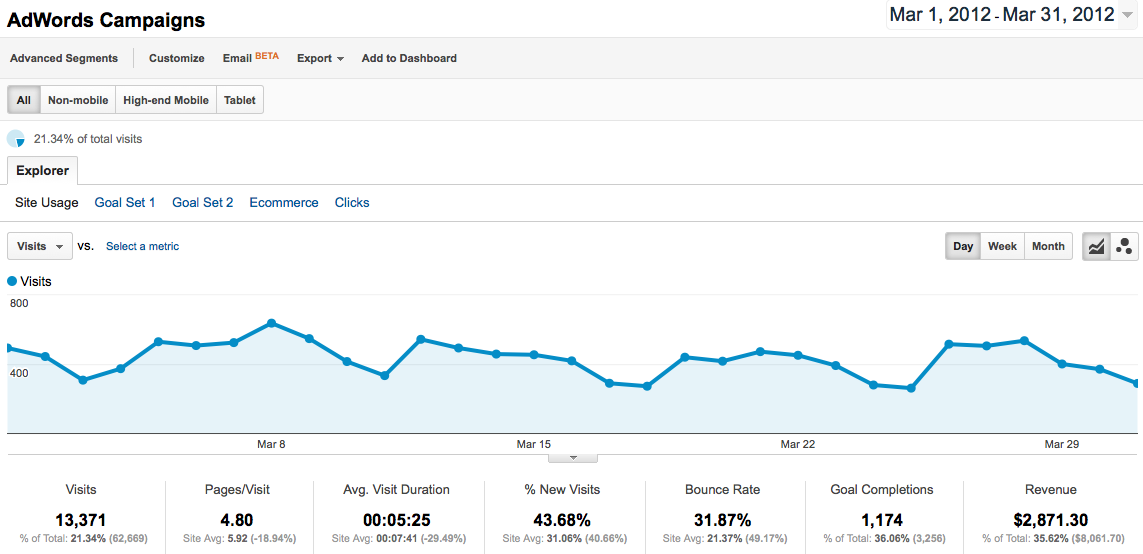
This is one of the most valuable tools for PPC. Did you ever wonder what happens after a search clicks on your ad? Here, you can analyze which campaigns are bringing in revenue and how effective your keywords are. You can see what time of day the most conversions are coming and what landing pages are creating the biggest revenue splash. Now you can optimize your PPC account on the front end by utilizing post-click Analytics data. 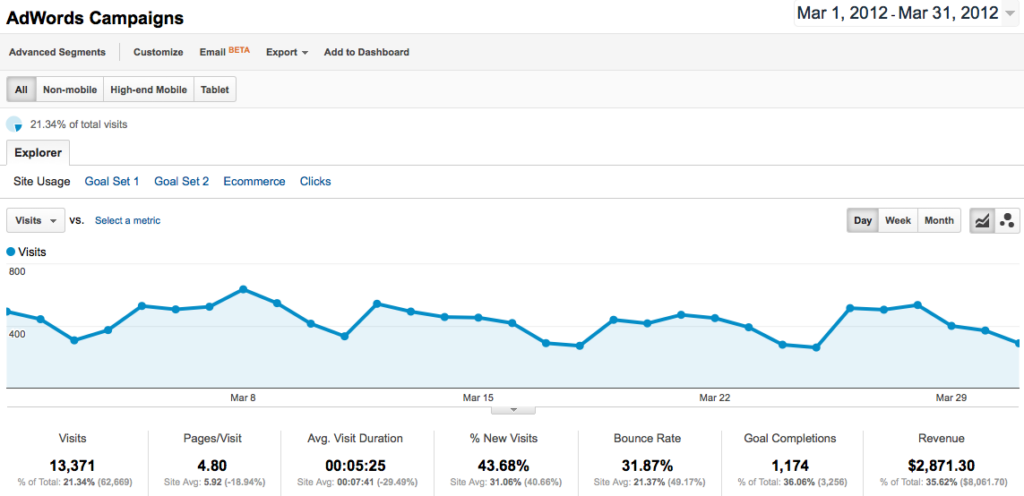
6. Traffic Information
How are people getting to your site? You can use the information in the Traffic segment of Analytics to measure metrics like conversion rate, per visit value, revenue, bounce rate, and pages per visit. Traffic segment options include Direct, Referral, Organic and Custom Campaigns (can be a combination of all sources). You can also view information about SEO optimizations based on queries, landing page stats and geographical information. Need to know if people are coming in from Social sites? Find it here as well!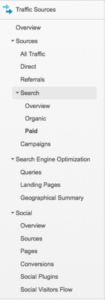
7. Conversions
For clients that are concerned about gaining leads (and really, what clients are not?) this is the segment for you. Within this area of Analytics you can find stats on goals for lead generation and ecommerce, as well as the ever-popular tool, Multi-Channel Funnels. For Analytics, a goal is defined as the completion of an activity on your site that is important for business, like a sign up for information, or a purchase from your site. In order to use the tracking for conversions, you need to set up goals and goal funnels. Read more about those here!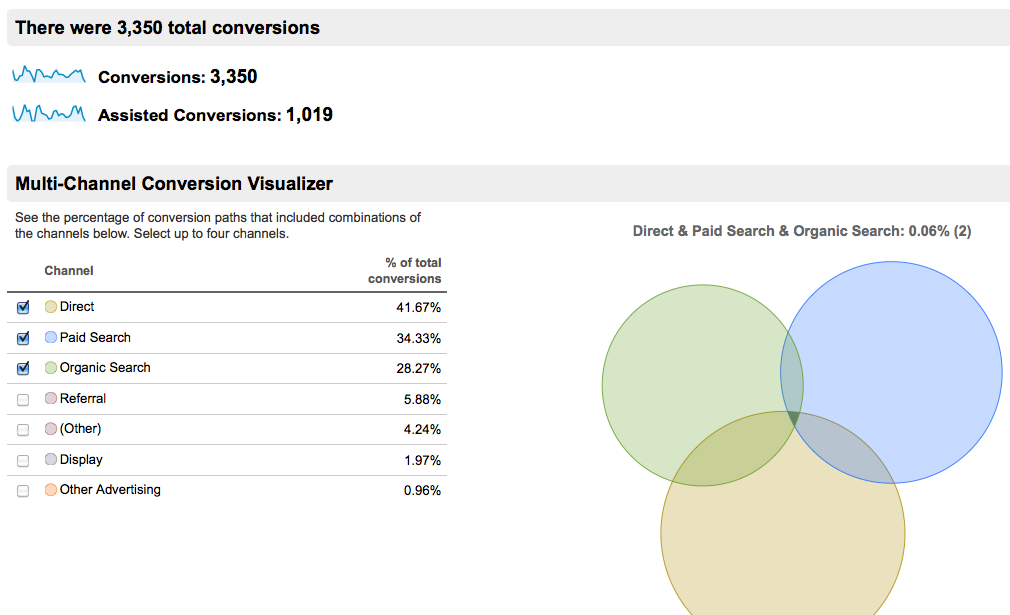
8. Content
The Content report is great for both PPC and SEO efforts. This will let you know what landing pages were frequently visited and which have high bounce rates. By reviewing this data, you will be able to optimize your landing pages in order to give the user a better experience and bring in more qualified leads for your client. 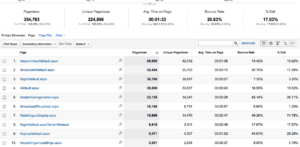
Presenting Your Findings: Reports
Where to Look: the Custom Reports tab
9. Flow Visualization
This is a more recent addition to the Analytics reporting family. These reports are graphic representations that follow the path or route of a searcher through your site. Review this report to find out the relative volume of visitors in each step within the path as well as where visitors backtracked in the path. You can choose the dimension that you would like to review and additional information is available by hovering over specific spots in the graph. To learn how to set up your Flow Visualizations, click here! 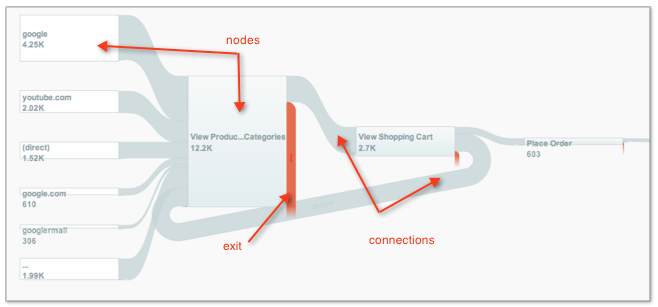
10. Custom Reports
Pick your dimensions, pick your metrics, decide how they should be displayed and Ta-Da! – you have a custom report. Custom Reports allow you to quickly review information about your account instead of digging through the above 9 areas of Analytics. You can edit reports at any time if your client’s focus changes or if you decide you would like to track other metrics. There are many different reporting combinations that you can choose from, but there are some combos that just don’t work. For a list of valid combos, click here!
Had enough yet!? Oh you just wait! Your beaker is about to boil over with the rest of our series! Analytics is jam packed with exciting information that can make PPC magic happen in your account. It’s just a matter of knowing what to look for and where to look for it. You really can become your own PPC Mad Scientist here! The tour of our Google Analytics Test Lab is now complete, but stay tuned for Kayla’s post tomorrow about finding opportunities within Analytics.


