Auction insights is a feature that Google launched in May of 2012 and it is incredible. It lets you see who is participating in the same auctions as you along with their impression share and some other fun metrics.
I was so awe-struck by the all-encompassing awesomeness of the feature that it took me until recently how to figure out a way to use it in new and exciting ways. (The normal ways of using it still feel new and exciting, so to make something feel even newer and more exciting took some doing.)
If you isolate certain keywords in your account that are either high value or highly competitive, you can slice up different time frames and get a sense of what your competitors are doing. Through a little trickery you can see not only how aggressive your competitors are, you can also see if they’re bad at managing their budgets. You can then cater your bidding strategy to fill the void when they’re not in the picture.
Here are the steps I take to get a clearer angle on my competitors:
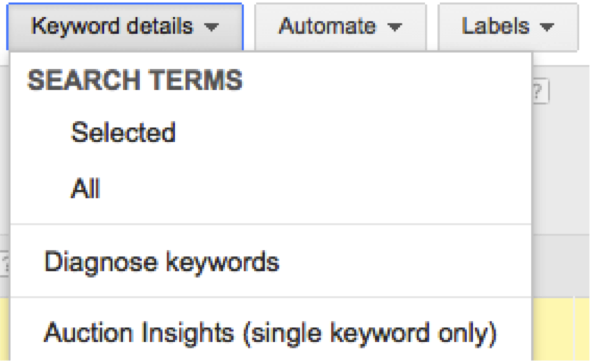
Head over to the keyword tab and download an auction insights report for one keyword (you can really only do it one keyword at a time, and this process takes a bit of time, so make sure to choose keywords that will tell you some good info). It’s in the same “Keyword details” drop down that you get your search term reports from.
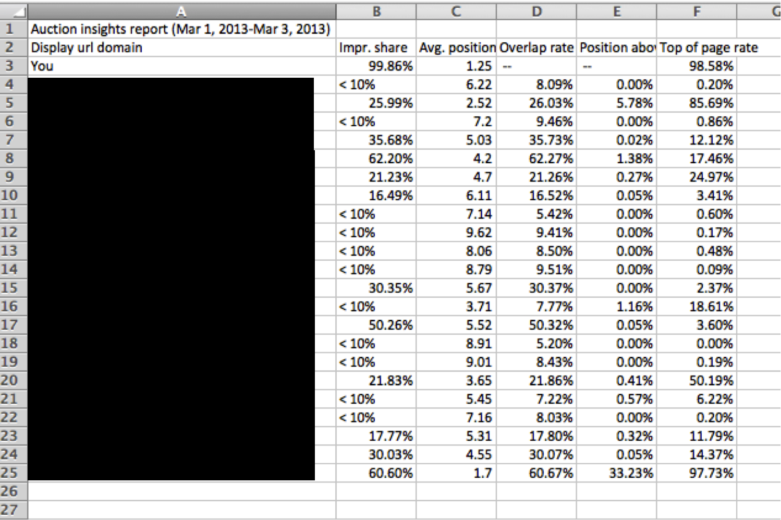
The data that it will return will look like this (and also include the display URL domains of everyone else that’s in the same auctions as that keyword):
Download that report into Excel, as we’re eventually going to be putting all of this into a pivot table. (Are you as excited as I am?)
Here’s what that report will look like:
There are five columns that this report gives us: impression share, average position, overlap rate (when your ad appears alongside that specific competitor’s), position above rate (how often that competitor is above your ad), and top of page rate.
For this specific exercise we’re going to be looking at regular old impression share, but there are plenty of options with the other metrics if you just put your mind to it.
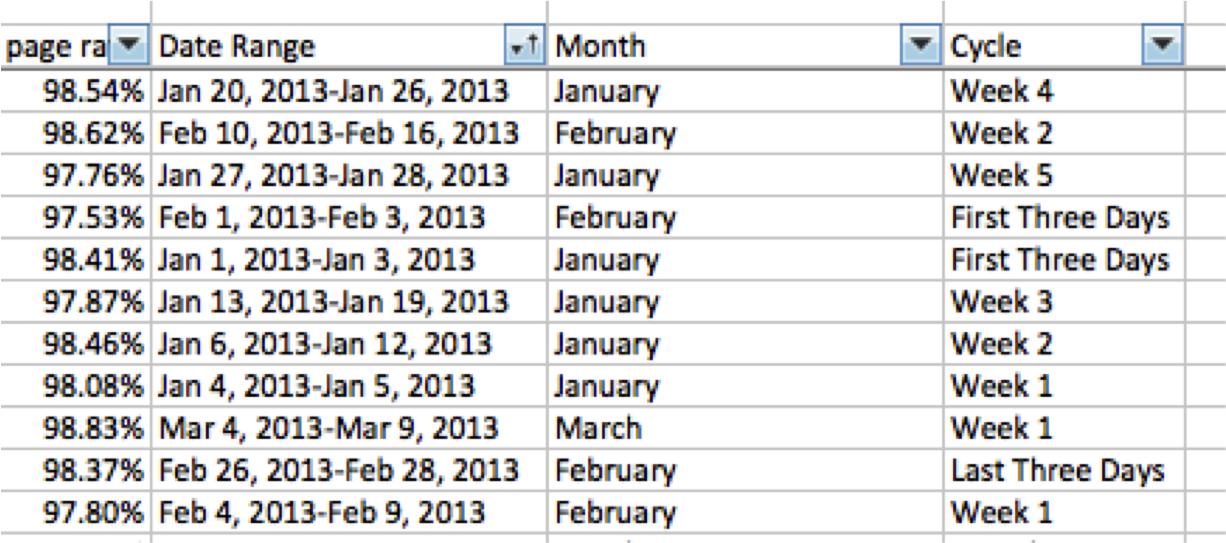
In your spreadsheet, you’re going to want to add in some extra columns next to the end of your data, as that’s what we’re going to use to analyze things. I personally recommend adding date range (as you’ll need to pull in different time frames to see how your competitors’ behaviors are changing), month and cycle. Here’s what I mean by cycle:
At which points in the month are super aggressive and at which points do some of them exhaust their budget and stop appearing entirely? To find that out, I break up a month’s worth of time into the first three days of the month, weeks 1-4 and the last three days (excluding the first and last three days’ worth of data from any of the weekly breakdowns so your data doesn’t get muddled). Here’s what your data can look like once you’ve downloaded a whole bunch of these and coded them:
I prefer to go back three months when I’m looking these up, as the data should still be pretty fresh, yet it should still be enough to establish a behavior pattern for your competitors.
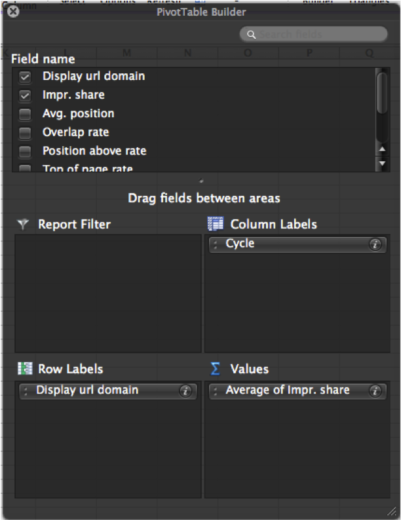
Now you can run a pivot table. Here’s what the pivot table builder looks like when you run this specific analysis:
The row labels are just our display URL domains (meaning our dastardly competition). The column labels are cycle (which is one of the coded fields that we just created). And the values of our table are the averages of all of those competitors’ impression shares. Your table will most likely default to count impression share, so make sure to change it up to average.
Then, you’ll be able to start seeing some pretty cool stuff.
Such as national competitors having giant budgets that mean an increased impression share at the end of months. They probably don’t run out of money like us mortals do, which means we can count on them being there for all times.
And you can also find some of your competition that should probably cool it a bit coming out of the gate each month, as they consistently run out at the end of the month.
Don’t tell them about their mistake, though. Just bid like you normally would and plan a little bit of extra budget for the end of the month when one of your main competitors drops out of the field. Be prepared to sop up that higher average position and cheaper CPC.
There are other time segments that you could pull in along with monthly cycles:
Days of the Week
Weekends vs. Weekdays
Before/after industry updates
If anything goes haywire in one of your accounts
The main limiting factor to all of this is the labor-intensive process of pulling this data across so many date ranges. As once you get your hands on this stuff, there are so many things you can accomplish with it.
Hopefully this approach will give you a leg up on your competition. And hopefully at some point we’ll be able to download all of this sweet, sweet data a little faster. (There may be a way already, so if you guys have found it please let me know!)


