Determining the overall success of a Display campaign can be difficult. While we can tell whether or not it’s been a success for us in the limited context of our own accounts, we’re often left stumbling in the dark when it comes to our performance versus the competition. Luckily, Google has provided us with a new tool to examine just how we stack up to the competition in the form of the Display Benchmarks tool.
Prior to this point, our knowledge of the competition has been fairly limited. We get a limited snapshot idea of how our metrics measure up against our competitors using the “Competitive Metrics” category in the Columns drop-down menu. But Auction Insights, Relative CTR, and Impression Share reporting can only go so far, especially since they’re still only going off of your account stats as a reference point.
The Display Benchmarks tool aims to change some of that. While fairly limited in capability right now, it does aim to restore some of the functionality lost when Google changed their API Terms & Conditions last November. Specifically, it was when they revoked the right to utilize account statistics in aggregate to analyze industry trends. While the announcement sounds more like a pitch for Rich Media ads, the overall point is sound: industry benchmarks can help provide you with greater context regarding the overall success of your display campaigns.
The interface itself is fairly simple – but also fairly limited at the moment. You have the option of narrowing your industry snapshot by selecting any or all of the following:
- Countries – Australia, Brazil, Canada, France, Germany, Ireland, Italy, Netherlands, Singapore, Spain, UAE, UK, and the United States.
- Verticals – Arts & Entertainment, Autos & Vehicles, Beauty & Fitness, Business & Industrial, Computers & Electronics, Finance, Food & Drink, Health, Internet & Telecom, Shopping, Travel, and Vehicle Brands.
- Ad Sizes – Leaderboard, Masthead, Medium Rectangle, Skyscraper, and Wide Skyscraper sizes.
- Ad Formats – Rich Media Formats, Flash In-Page Ads, Static Image Ads, and Mobile Display.

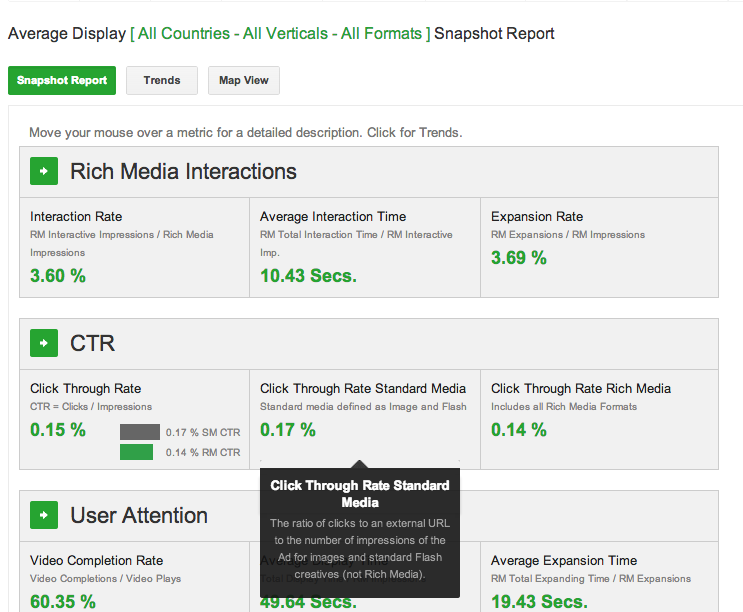
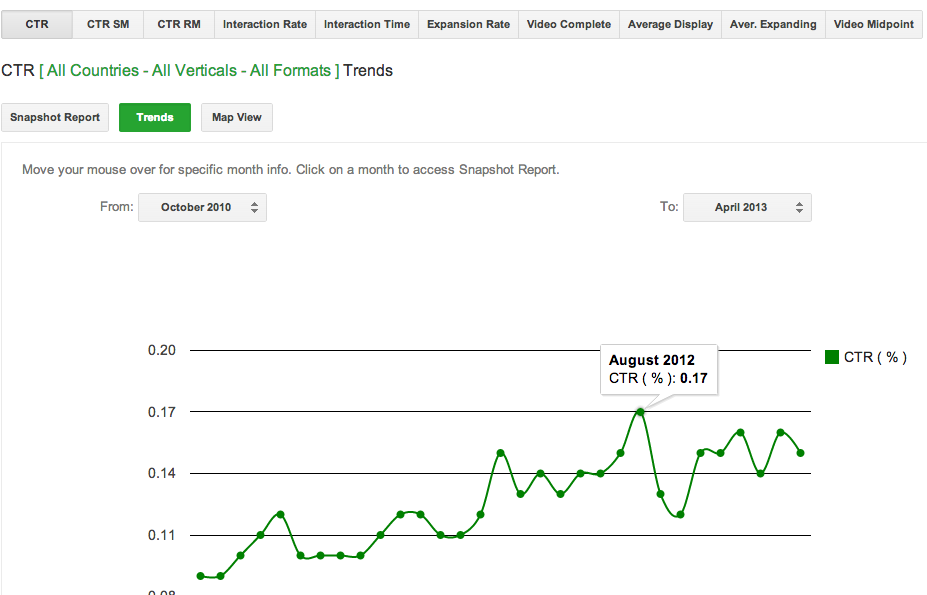
You’re then presented with a snapshot of statistics based on the criteria that you selected above, as well as the option of viewing both trends:

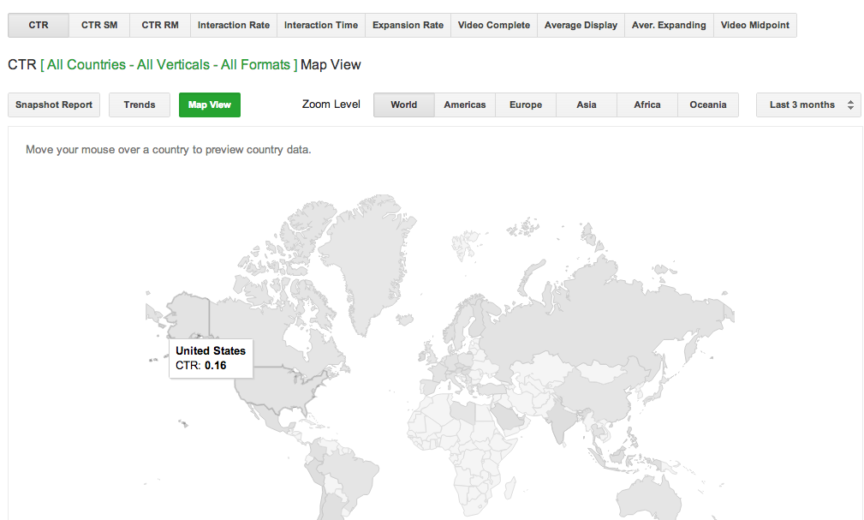
And geographic performance:

You’ll note at the top of each image, you have a row of different statistics to select. You’re basically limited to an analysis of Click-Through Rate and various Rich Media engagement metrics. So here are the immediate pros and cons of the system as we see it right now:
Pros:
- You get a better idea of how your Click-Through Rate stacks up on an industry-wide scale.
- The you can analyze industry performance by ad size and format, indicating potential gaps in your Display advertising. If certain ad types perform much better in your vertical than others, it might be worthwhile to expand on those strengths.
- If you actually use Rich Media, the engagement metrics will be helpful to you.
- Pretty graphs?
- The “trends” portion can help you identify whether or not performance slumps were due to mistakes or if the entire industry/country had a down month.
Cons:
- Of all the countries on Earth, only 13 are actually listed in the “Countries” drop-down menu.
- Similarly, of all the industries on Earth, only 12 broad categories are included here. Such broad swaths may not be helpful to your specific business.
- No idea of competition in terms of spend, CPC, or conversion information.
- If you don’t do Rich Media, the only thing you’re getting out of this is some Click-Through Rate information.
More data is usually a good thing, especially when it comes to measuring up your competition. The new Display Benchmark tool has the potential be a nice (and more importantly, free) way of giving you a little more context to your performance on the Google Display Network.
What about you, PPC Heroes? Have you had much success measuring your competition with this new tool? Or do you prefer some of the paid competitive research tools instead? Let us know in the comments and, as always, thanks for reading!


