When it comes to competitor analysis, there is no such thing as too much information. During our monthly training day this month, we had a discussion about competitor analysis and how (most) clients show an interest in what their competitors are doing.
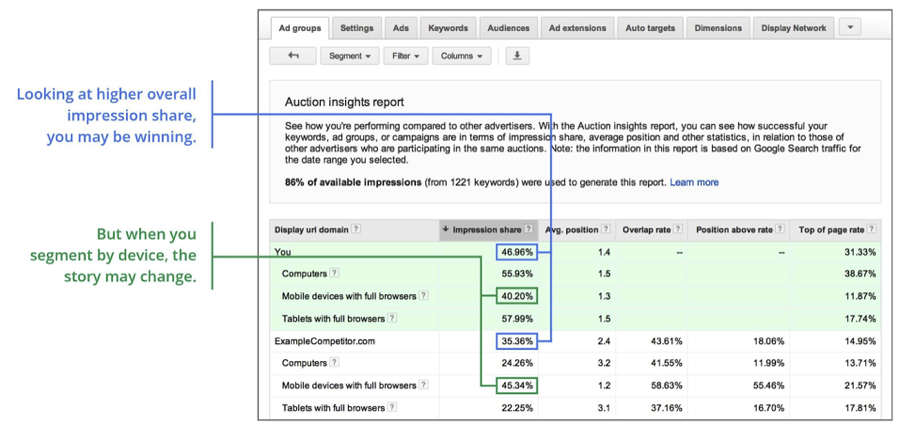
One tool that is used to measure performance against competitors is Auction insights reports in AdWords. While this report is useful, it doesn’t provide the whole story, and doesn’t give you a ton of information. Luckily for us, Google announced on Friday that you now have the ability to segment by device type as well as time period.
Where To Find It
The Auction Insights report can be accessed at the campaign, ad group, or keyword level by clicking on the details button.
Once you navigate to the report, you can view data segmented by device or time of day by clicking on Segments.

Here’s a quick overview of the metrics available:
- Average Position: average rank of the ad in the auctions
- Impression Share: number of impressions you received / estimated number of impressions you were eligible to receive
- Overlap Rate: how often another participant’s ad received an impression when your ad also received an impression
- Position Above Rate: how often another participant’s ad was shown in a higher position than yours was (when both were shown at the same time)
- Top of Page Rate: how often your ad (or participant’s ad) was shown at the top of the page
Why It’s Useful
While metrics like overlap rate, impression share, and position above rate are useful to look at by themselves, you get more insight into the competition using devices. For example, your competitor may have a 95% impression share, but they have 100% of the impression share on mobile devices. To stay competitive, you may need to rethink your mobile strategy.
Segmenting by time periods is also a nice way to see how the competitive landscape has changed over time. This is a nice report to illustrate another way your hard work optimizing PPC campaigns has paid off, especially if your client is interested in gaining market share. If you find that a particular competitor’s position above rate and impression share have been increasing steadily over the past few months, that may be a good sign that you need to do a bit more research into that competitor and find out why you’re missing out.
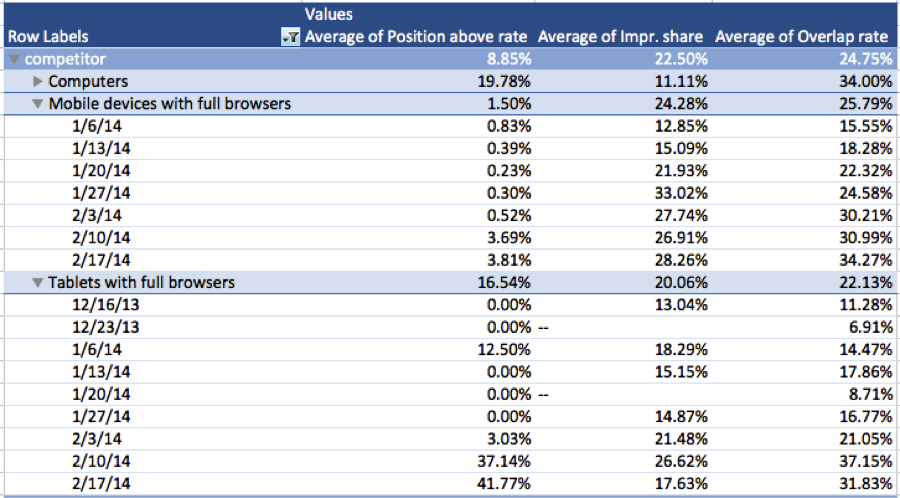
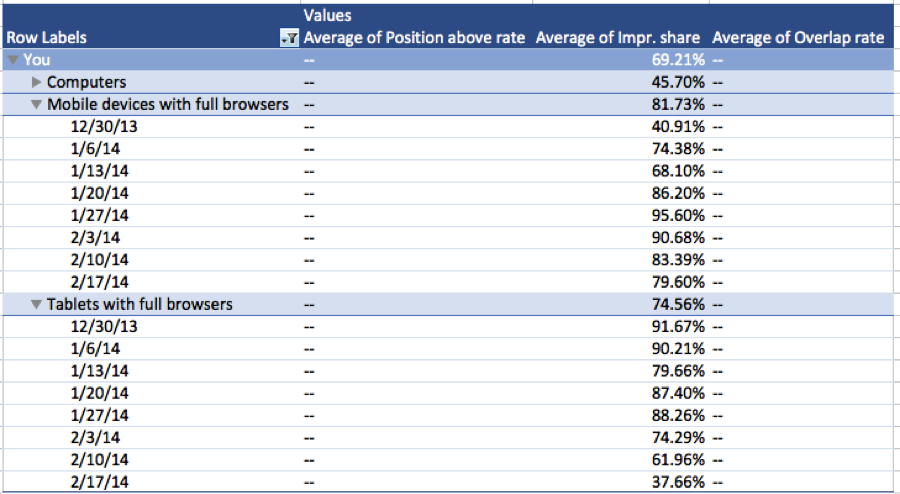
You can also put these two metrics together, and with our handy-dandy Excel pivot table it’s easy to see how impression share changes over time. Take this example:

Our competitor’s position above rate has increased significantly within the past two weeks, along with their overlap rate.

At the same time, our impression share has been steadily decreasing. This client gets most of their traffic from mobile devices; so this is definitely something we’ll want to keep an eye on to stay competitive.
Things To Keep In Mind
It’s important to note that Google only uses a portion of available impressions to generate the Auction insights report, and your campaign/ad group/keyword of choice has to meet a minimum level of activity during the time frame selected. This means that you might not be able to pull the data for all of your keywords. To quickly see which campaigns/ad groups/keywords have data, you can add a filter:

The Auction insights report also does not give you any information about competitor’s keywords, or the number in keywords that you have in common with them. I find that it’s useful to use Auction insights as a starting point in your competitive analysis, then using sites like SEMrush and Spyfu to get a better picture of what your competitors are doing. With these other tools you are also able to choose which competitors you want information on, while Google only gives you a few.


