In my previous blog, “How to Pivot Paid Search Data in Excel” I went into great detail about how to perform a pivot table with an example on how to look at that data across multiple channels. Today I am going to dive deeper into how to look at audiences, ad copy, and data over time.
Audience Reporting
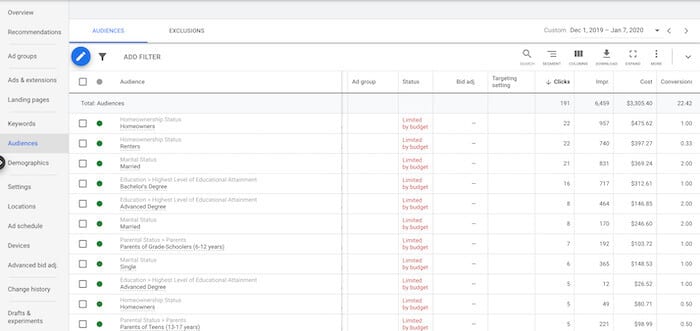
The best way to get comfortable with pivot tables is to download data and play with the information. Below is an image of the Audience tab in Google and I downloaded a basic audience report.
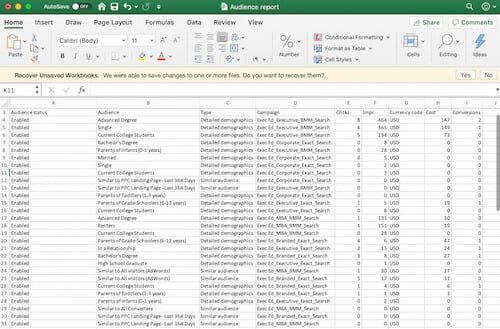
Once you have the report in Excel, this is a good time to remove and columns you do not want to use in your pivot table to help reduce the number of columns for you to select.
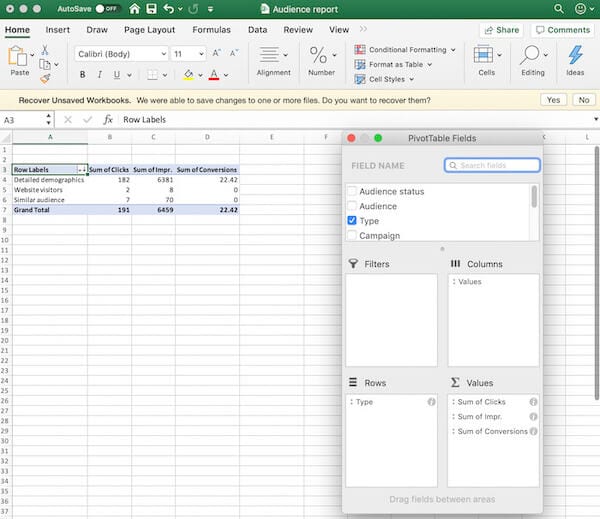
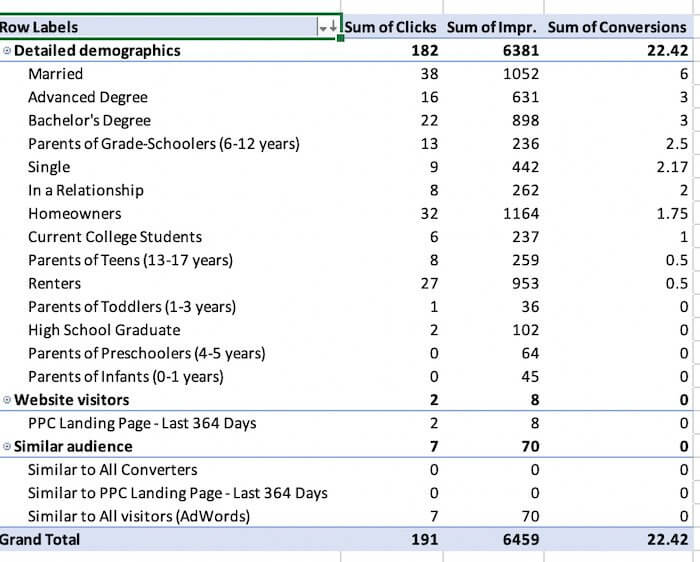
With the pivot setup, I have the type of audiences selected with basic metrics of impressions, clicks, and conversions to show how the data pull. For this campaign, we are only seeing conversions coming through on our Detailed Demographics.
By adding another row we can see even more detail about which specific audiences have converted for us.
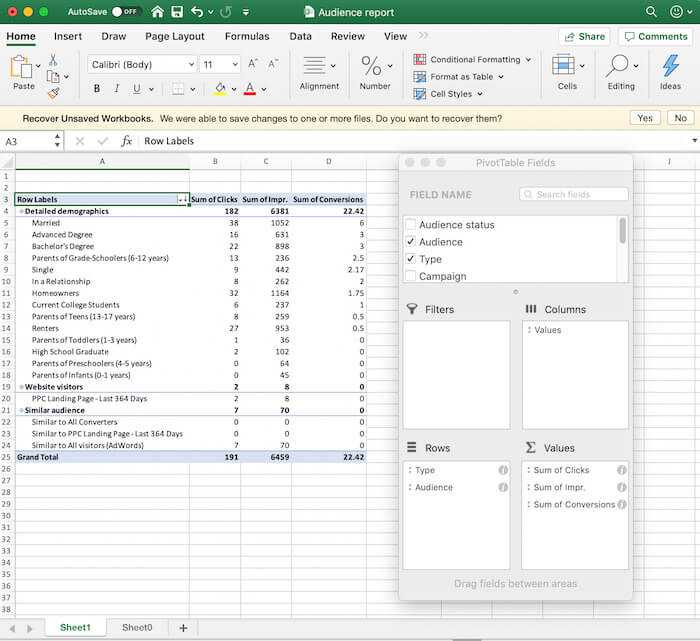
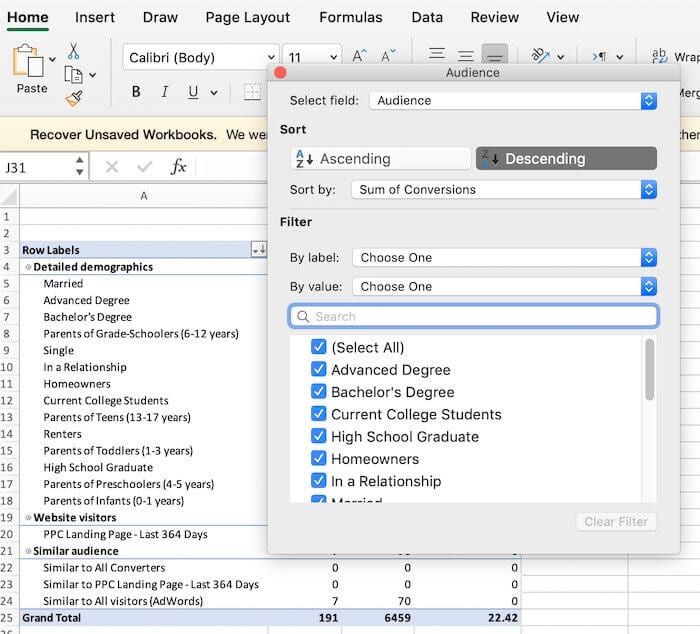
After I have this information, it would be easier for me to see the conversions if they were ranked from the highest conversions to lowest. By selecting the carrot by Row Labels and selecting the Audience field, I can sort by conversions and hit descend. Now my data will sort by conversions for me to quickly see which audiences I should increase by bid modifiers.
Here is a close up of how the data looks after our sorting. This client focuses on higher education so increasing our bids for Advanced Degrees and Bachelor’s Degrees makes sense. I can also pull a similar report like this for gender, ages, and income levels to decipher if we should make any bid recommendations based on past performance.
Ad Copy Testing
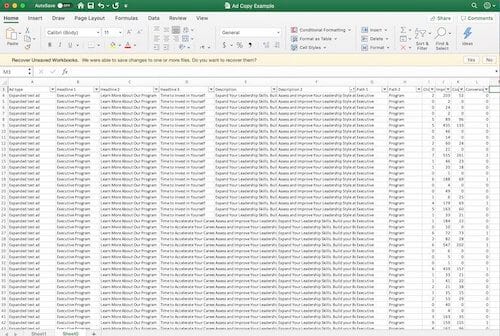
Now that you have more practice by playing around with audience data, you can feel comfortable downloading data with more aspects. The next example starts with pulling an ad report, and I have removed any columns that I do not want to use in my pivot to make it easier to find the data segments I need.
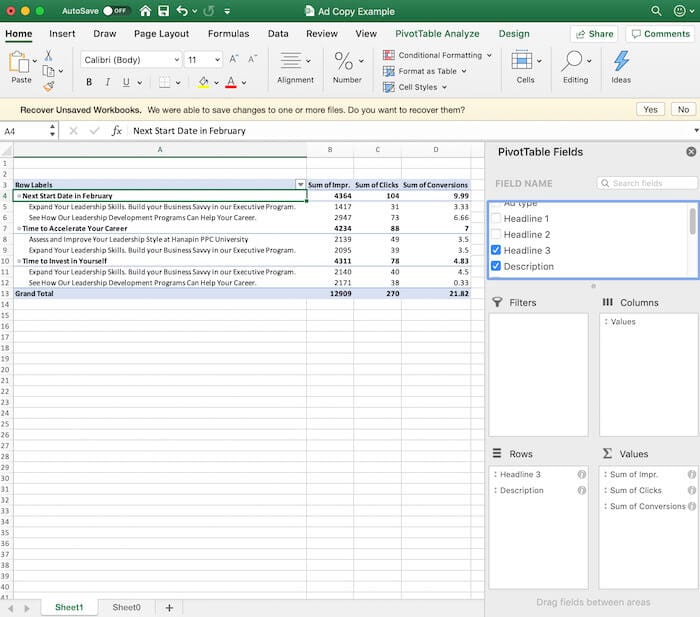
Once you have the data you need to go ahead and create your pivot. I have selected to look at my Headline 3 ad copy since this was part of our most recent test.
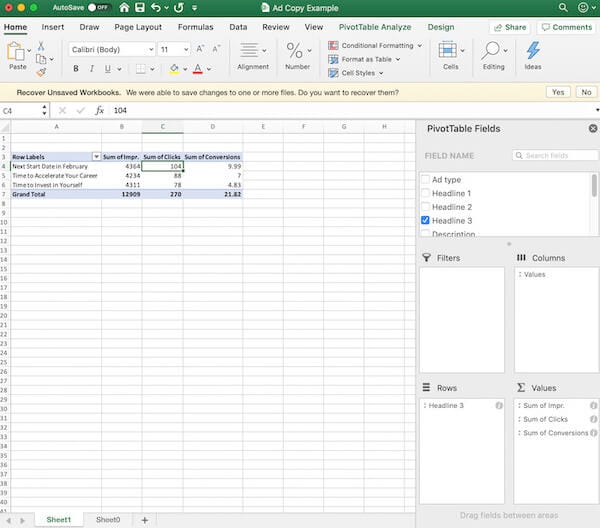
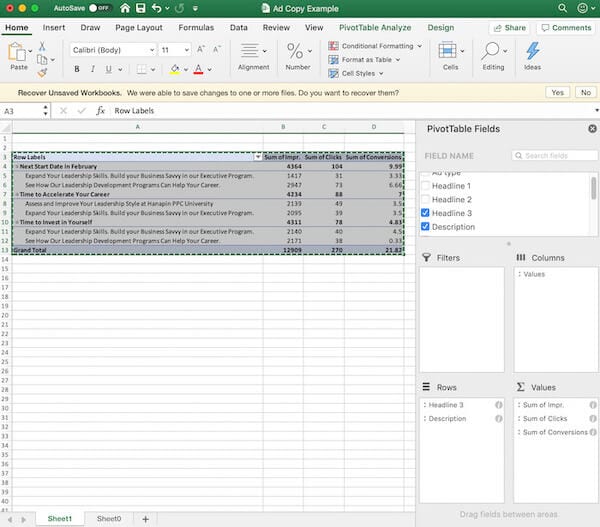
This shows how each headline performed on its own, but I want to dig further to see how the headlines performed with other parts of the ad. To do so, I am going to drag the Description field down to the row section of the pivot so I can look at performance side by side.
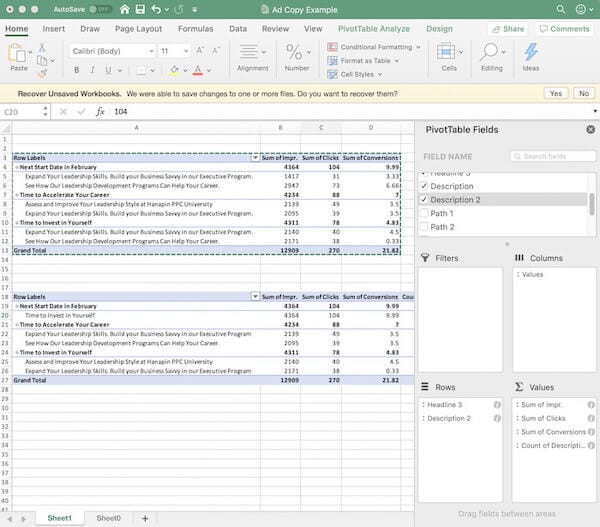
I can swap out the different descriptions and compare them, but I would rather copy and paste my existing pivot table and edit which description I am looking at so I can compare them side by side. This saves time from having to create a new pivot from scratch but also allows you to save multiple pivots on one Excel sheet for your own analysis.
Dates
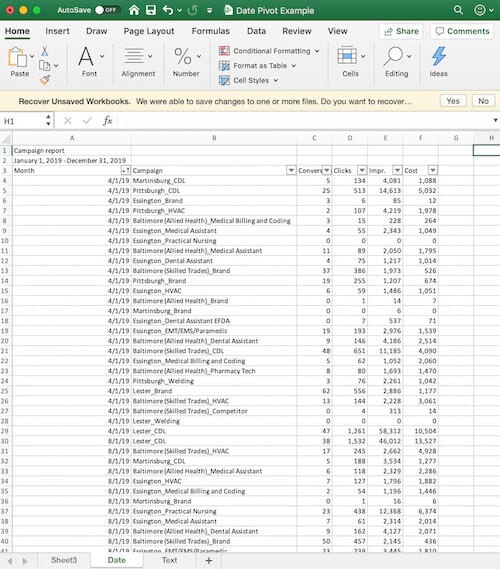
Lastly, I am going to show you how to work with dates within the pivot table. I have an example of a report pulled directly from Google Ads and the date is in a text format. I can leave the date as is but you will see that this might not be the best want to look at the data.
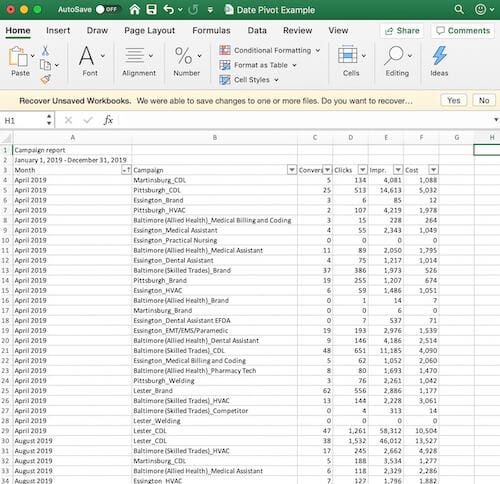
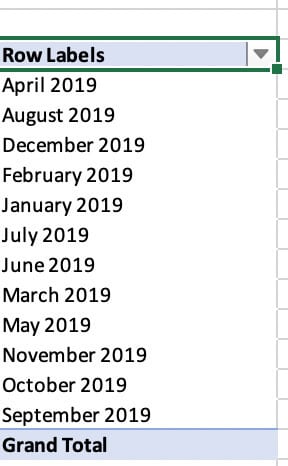
Below is my pivot showing the date as a text, and it pulls the months alphabetically instead of in chronological order.
I have now gone through and changed the dates to short form and here is how the data now looks in Excel before I pull the same pivot table.
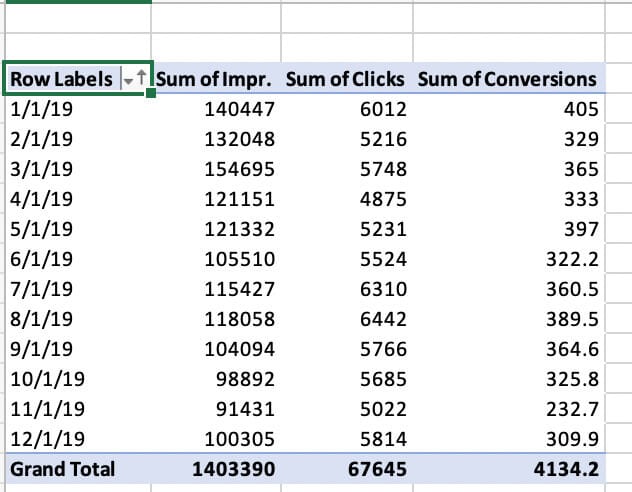
Now that I have the dates in the new format, the months are coming through in order instead of alphabetically.
I can now show you one last trick, you can use conditional formatting within the pivot table and we will see there is some seasonality with this account.
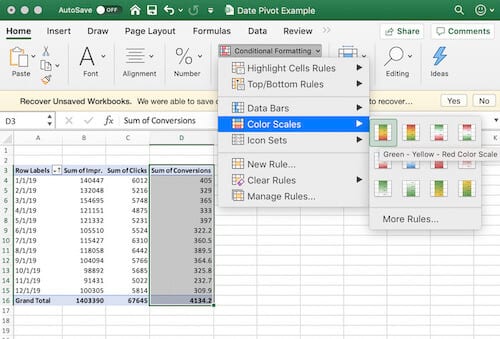
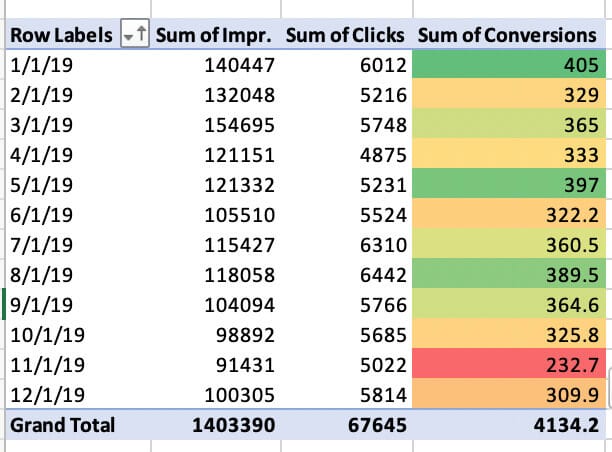
With this client, we have our busiest and most successful campaigns in Jan, May, and August and the data reflects this. I have used pivot tables to show seasonality from the past to help predict how much we need to spend in the future. Once you are comfortable formatting your pivot table you will find that you can turn raw data into easily digestible bits of information for you and your clients. To learn more about Excel here is The Complete Guide to Using Excel for PPC.


