With the appearance of concepts like attribution modeling and holistic strategies across channels, data integration has become a major daily challenge. Viewing the different marketing channels as silos is not an option anymore for marketers who wish to obtain the valuable insights needed to maximize performance.
For us digital marketers, an important part of data integration is the ability to track our investments across all marketing channels. If you are using Google Analytics, importing cost data from AdWords is easy, but with others marketing channels such as Bing, Facebook or Twitter, it gets a little more complicated. Fortunately, Google Analytics has a great tool called Data Import, which allows you to manually import cost data related to other marketing channels.
In this article, we will review the process of importing cost data through the Data Import tool in order to create a custom report comparing return on advertising spend (ROAS) across different paid search channels.
Here are the 4 steps to achieve global view of cost data across channels:
- Make sure all marketing campaigns are properly tagged.
- Create the cost data source in Analytics.
- Import cost data.
- Create a custom report to visualize cost across channels.
1. Make Sure All Marketing Campaigns Are Properly Tagged
Cost data importation is not possible without proper campaign tagging. Tons of articles have been written about this topic, nevertheless, it is still frequent that Facebook, Bing, or Twitter campaigns are not properly tagged.
Since tagging is not the topic of this article, I strongly encourage you to read the guide “URL Tracking in Google Analytics” to learn more about tagging best practices.
2. Create The Cost Data Source In Analytics
Before importing cost data to analytics, a cost data source has to be created. In order to do so, you will need to click on admin and then “data import”. From here, you will be able to create a new data set. Note that having administrator access is mandatory in order to be able to create a new cost source.
Next step is to select the type of data set you want to create. In this case, we will choose “cost data”. There is much information that can be imported through this tool, such as user data (customer lifetime value, segment), product data (brand, category), content data (article author), etc.
Now we need to set up the data set. Choose a name and select the views where the costs are going to be applied. By selecting the view, you can control who will have access to this data (you may not want to display this information to everyone who has account access).
Next step is to choose the dimensions and metrics we would like to use. There are only a few options to choose from in terms of metrics: cost, impressions and clicks. When it comes to dimensions, there are a few more options: campaign name, ad group name, ad content, ad slot, etc. In this case, we are interested in the cost by campaign and keywords. We added impressions and clicks to use this data for further analysis. We are currently limited to 25 custom data sources, so I recommend putting all the useful metrics in the same data source. It will also simplify the data importation.
The last step to set up the data set is to select the import behavior, which will specify in Analytics how to handle cases where the same data has been sent twice. With “overwrite”, if duplicates are sent, the new data will overwrite the previous one. With “summation”, the new data will be added to the previous one. In our case, I recommend using “overwrite.”
3. Import Cost Data
We now need to import the data from the marketing channel, (Bing for example). To do so, we have to create a CSV file that matches Google’s template. The file is pretty straightforward to create for a single marketing channel. However, when it comes to Bing, it gets more complicated since we need to upload cost data by day for each keyword.
After defining the data set, we will be able to click on the “get schema” button that allows us to download the CSV template. The rest is pretty simple; we just need to fill out the template with the proper data.
Here is an example of the CSV file to import Bing’s cost.
Finally, the last step is to upload the file. To do so, we need to go to “manage uploads” and click on “upload a file”. The tool will provide a status specifying if the upload has been completed successfully or not. If there is a failure message, we can check the errors report to understand, find and correct the mistakes.
4. Create A Custom Report To Visualize Cost Across Channels
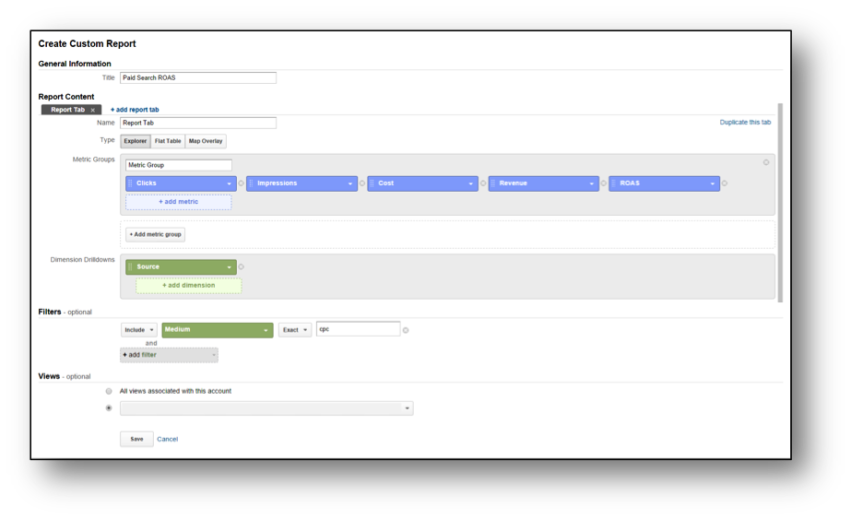
Now that all the costs have been imported into Google Analytics, you can start using this data in reports. Unfortunately, there is no built-in report that allows us to compare ROAS across channels. The good news is that you can create a custom one.
To create a custom report that compares ROAS across channels you will need to:
- Click on “Customization” at the top menu in Analytics.
- Click on “New Custom Report”
- Name your report, for example “Paid Search ROAS”
- Add the metrics you would like to tack, ie: clicks, impressions, cost, revenue, ROAS
- Choose source for the dimensions.
- Use the filter option to limit the report to CPC.

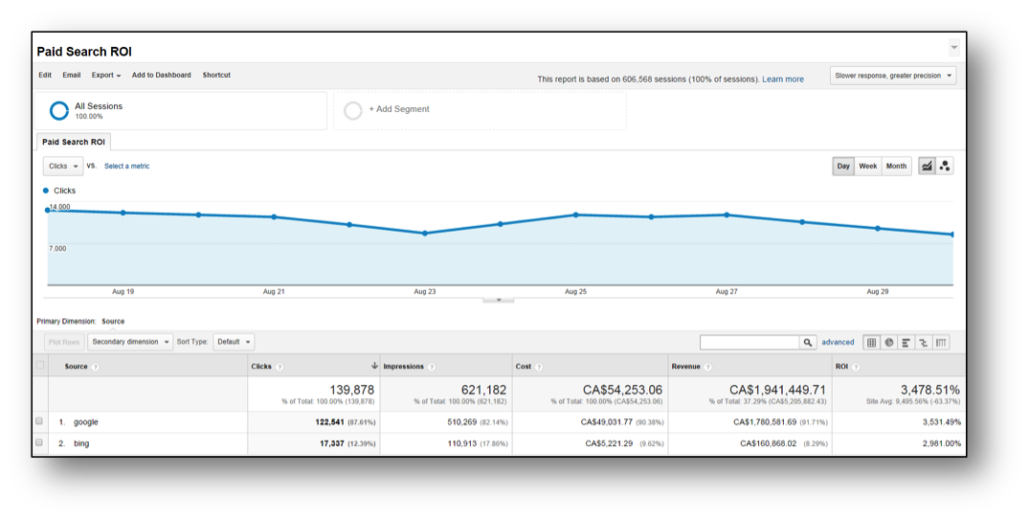
Once the cost data is imported and the report created, you will be able to quickly identify channels with higher value. You could then benefit from all the possibilities that Google analytics offers to perform more in depth analysis. For example, the next step could be to compare campaigns ROAS across channels.
Importing cost data is just one of many usages possible with the import data tool. The tool is great when aggregating all kinds of marketing data in one place. I encourage you to use it, as data integration will help you quickly track overall performance and to make meaningful decisions.
About The Author – Thibault Costet
Thibault is a paid media and analytics analyst at iProspect. Passionate about the web analytics and new technologies, he likes to find innovative solutions to problems associated with PPC management. Connect with Thibault on Twitter and on LinkedIn.


