As Pinterest strives to monetize their platform, they continue to listen to the challenges of advertisers and brands. One of the key challenges they tackled early on was Analytics.
Pinterest realized how important it was for marketers to understand how their audience interacted and engaged with their brand while on the platform. In an effort to make that analysis easier, they rolled out their own Analytics platform and regularly add new features to make the product more robust.
Below is a walkthrough of the Pinterest Analytics platform highlighting some of the key features for marketers.
Pinterest Analytics Dashboard
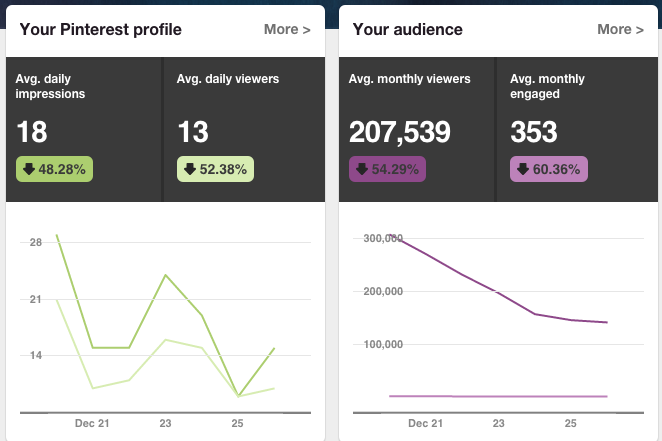
When you first log into your account (analytics.pinterest.com), you’ll be greeted with three dashboards:
- Your Pinterest profile
- Your audience
- Your activity (not shown here)
These three dashboards serve as a launching point for diving into your Pinterest performance. Simply click on “More” in order to enter that dashboard.
*In order to see the third dashboard you’ll need to confirm your website by adding a snippet of code on the website. Once installed you’ll see what people are pinning from your website—you’ll know how all your content is doing on Pinterest, not just the Pins you’ve saved to your profile.
Check Your Top Pins
Below your main dashboards is a snapshot of your 5 top performing pins over the last 30 days sorted by the highest impressions. Aside from impressions, you’re able to see the repins, clicks, like and pin type for each one. Note: promoted pins are designated with a “P” under pin type like in the example below.
Your Pinterest Profile
Let’s dive into the first dashboard called, “Your Pinterest Profile.” Within this dashboard, you’re presented with line charts and four different ways to segment the data.

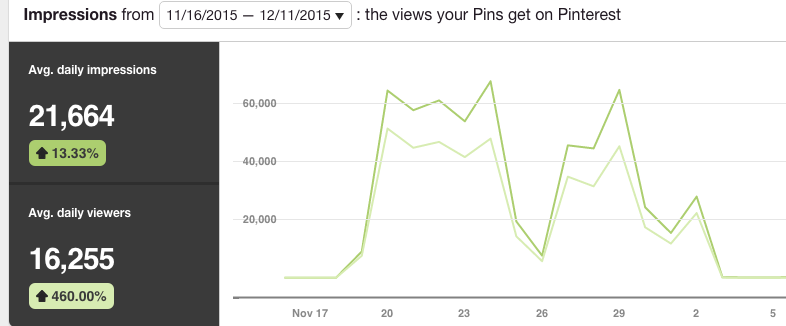
Impressions – this chart shows the total number of impressions and viewers on a given day. The left-hand side shows you the averages for both impressions and viewers.
Repins – this chart shows how your Pins spread across Pinterest. One line represents the amount of repins and the other shows the number of repinners or people who repinned your pin.
Clicks – this chart shows the number visits to your website from Pinterest. Again, one line is the total clicks and the other is the number of visitors. This does not show the total number of clicks on a pin.
All time – go here to find your best-performing pins broken down by your most repinned or shared Pins, Pins that rank higher in search, and Power Pins – Pins with a high mix of repins, clicks and more.
Top Pins And Boards
Under each section Pinterest highlights your top Pins and Boards for that segment. For example, if you wanted to see your most repinned Pins navigate over to “Repins” and scroll down to see your top 5 pins.
Or, if you wanted to know which Boards earned the most clicks to your website, go to “Clicks” and scroll down to see the top boards.
*Tip – Custom Date Range
If you need to view a specific date range outside of the preset 7 days, 14 days, and 30 days then follow these easy steps.
- Start by selecting the date for beginning range. Example, if you want to look at November 1st through December 15th then select November 1st. A circle will appear around the date.
- Then select the end date of December 15th for the range. Now you should have a custom date range selected.
All Apps And Export Data
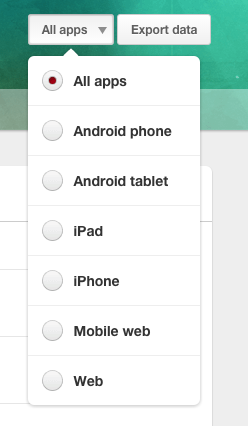
Another great feature to segment your audience further is under the “All Apps” section. By default, it’s showing data for all apps or devices. You can select an app from the list below to analyze how your audience interacts and engages on that device.
Use this information to understand how people perform differently or the same based on Android vs iOS or phone vs tablet.
Your Audience
Going back to the main dashboards, we’re now going to explore Your Audience section of Pinterest Analytics.
Demographics And Interests
Pinterest breaks this audience down by demographics and interests. Demographics shows the people who see your Pins and people who act on your Pins.
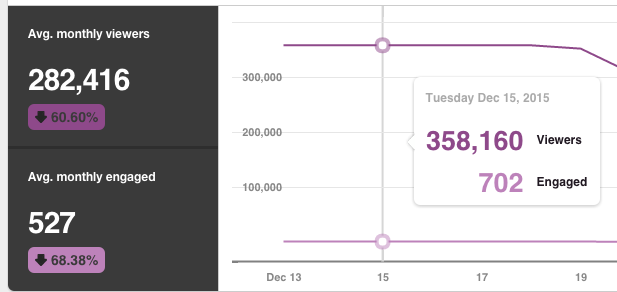
The chart below shows the number of viewers and the number of people engaged on a given day. Again, on the left-hand side we can see an average monthly number of viewers and engaged people.
Analyze this information to check out how engagement trends over time. Understanding where your audience is from can help you find new opportunities for marketing.
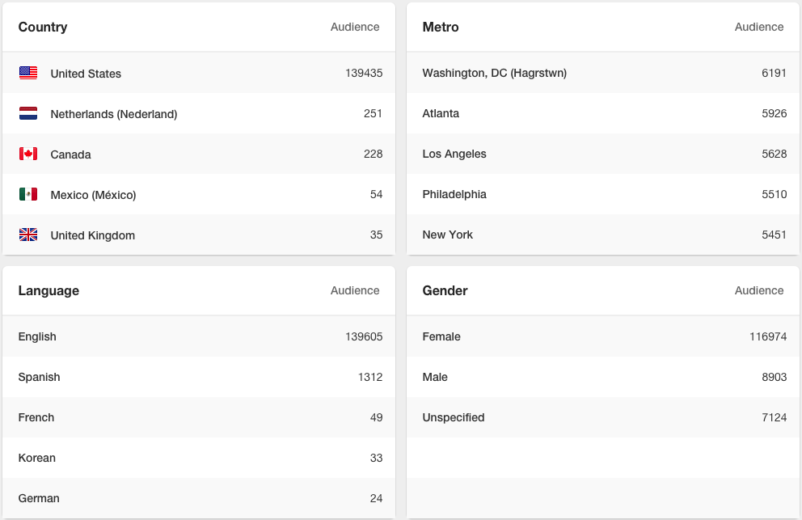
Below the chart is a breakdown of your audience by top locations, languages, and gender. According to Pinterest,
- Country – based on country settings the Pinner chose
- Metro – this is only available in the U.S. right now. It’s based on DMA data provided by Digital Envoy.
- Language – again, this is based on Pinner account settings
- Gender – this is based on Facebook settings and what the Pinner chose when they signed up for Pinterest.
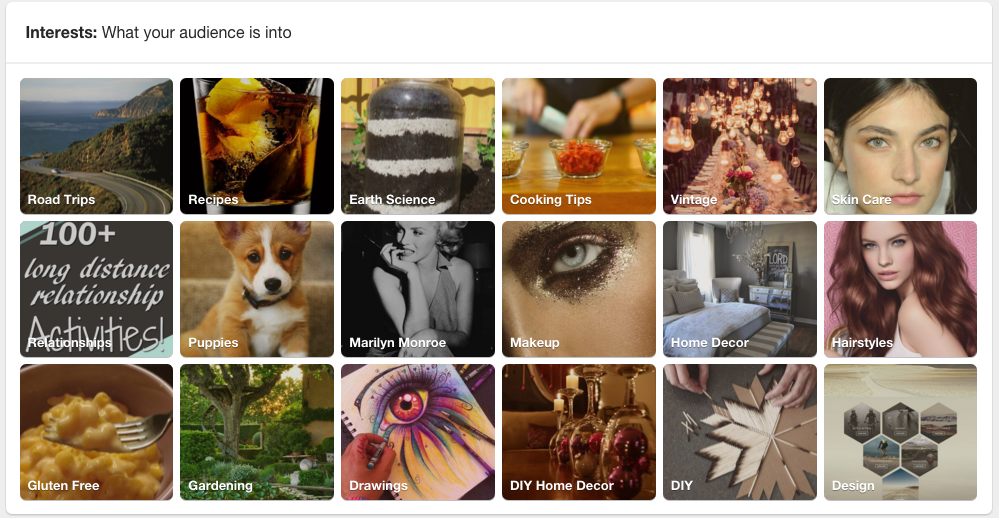
Interests – What Your Audience Is Into
This is a relatively new feature in Pinterest. Think of this information like your Google Affinity audiences. They are a visual representation of the popular categories that your followers are into. It’s designed to help give you more ideas about the content your audience may like.
Boards – Pinner Boards With Lots Of Your Pins
Pinterest compiles a collection of boards from your audience that contain your pins. It’s a great way to see how your audience organizes your pins and thinks about your brand.
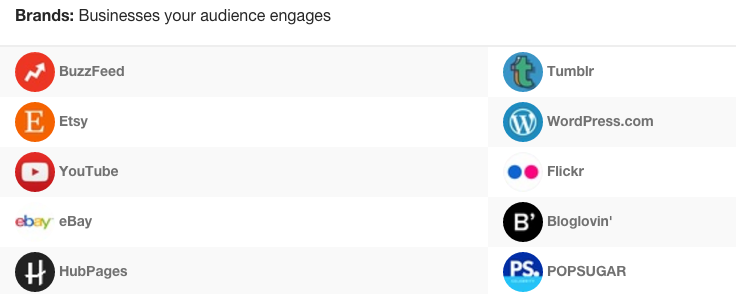
Brands – Businesses Your Audience Engages
Talk about competitive research! Pinterest outlines the main businesses that your audience engages with. Now you can see what other business are pinning that your audience finds so engaging. Or, you can learn what your audience is hearing from other brands as a clue to what they’re interested in.
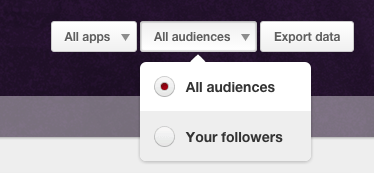
All Apps – All Audiences
Pinterest offers a new way to segment your data either by all audiences or your followers. All audiences aggregates all people who have interacted with your pins. And your followers just shows the demographics and interests make up of the people following you.
It’s an excellent feature when trying to understand the similarities and differences between your viewers and engaged followers.
Export Data
Lastly, Pinterest offers you the opportunity to export this data as a CSV file. Depending on what you’re exporting, you’ll more than likely get a list breaking down the current data by section complete with links back to the pin, board or business. It’s a really handy feature when trying to compare audiences over time.
Over To You
Pinterest Analytics is evolving into a platform that where savvy marketers can gain insights into what their customers want. The platform isn’t without it’s weaknesses. However, as more advertisers demand more insights and analysis, Pinterest will have to keep adding features if they want to monetize their platform.
In the meantime, marketers will need to get better at learning from the data provided by Pinterest to inform strategies and tactics.
How about you? Do you like Pinterest Analytics? Have you ever used it to analyze your campaigns? I’m eager to know your thoughts so please share them in the comments section.


