This week we’ve been explaining the value behind the regular tactics and routine maintenance you hear so much about from our PPC Hero team.
Today’s lesson involves the concept of projecting performance for the upcoming weeks.
First, let me address the “why” of projections performance. The entire concept of this exercise is to get an estimate of, ceteris paribus, the performance you’ll see down the road. While we cannot predict our certain future, we are able to look at past performance and quite recent performance and draw some conclusions from there. Because we are constantly changing our bids, keywords, targeting, and settings, we are constantly changing the winds of our account’s destiny.
In projecting performance, the most commonly recommended date ranges are:
Previous 7 Days
and
Month To Date
The majority of our account management runs in a month-long cycle, but these calculations also work on a quarterly cycle or 4-4-5 rotation. From the date ranges used, we specifically seek to calculate what we can expect for the reminder of the time period.
Today’s demonstration will walk through the use of P7D and MTD data for the projections for August’s performance for a particular sample account.
To begin, let’s identify the metrics we’ll evaluate. For this account, the most important metrics are conversion volume and cost. These calculations work for any metric you may be using, but let’s keep it simple with the old standards.
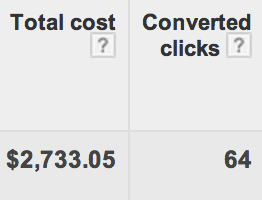
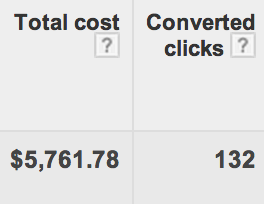
For the past 7 days, my client’s Google account has received 64 leads. In this time it has spent $2,733.08. In the month so far, it’s spent $5,761.81 and generated 132 leads.
Now for the math party!
First things first, how many days are left in my calendar month? Let’s say the date of data pulled is August 16th. That means we’ve got 15 more days of wheelin’ and dealin’ before I need to reach my goals.
Now let’s take your Past 7 Days Cost ($2,733.08) and divide it by 7 (to find the average current spend these past seven days).
You’ll then multiply this figure by the number of days remaining in the month. (15 days)
From there you’ll add what you’ve spent so far this month (Month-to-date Cost of $5,761.81)
And that is what you’re projecting to spend this month!
Let’s go through this process one more time, this time looking for conversion projections:

Takeaways
Now how is this useful? Well, if my account has a monthly spend cap of $11k, this tips me off to the fact that we’re set to go a little over. While it’s not the end of the world, it certainly indicates that I’ve got just 2 weeks to pull back in whatever ways I need to stay within my budget restrictions.
Similarly, I can see at a glance how my conversion volume is projecting. Maybe I thought it was going poorly earlier this month, but after increasing some bids or adjusting some targeting, I’m seeing better results. In this case, my projections are a kind old sage, assuring me that my optimizations are having a positive impact and it looks like everything is gonna be alright.
So, you may be reading this and having your mind blown. You may also be reading this with a furrowed brow, wondering how useful or even accurate this truly is. I mean, if we’re using the past week’s data and just the MTD numbers, aren’t there a million ways to get the wrong number?
Example: First of the month- If you have only had a day or two into the month and you’re trying to project for the remaining 29 days, is this really accurate?
Answer: Well, sure. You’re looking to the past week as the main indication of what’s coming down the road. If you’re only a day into the month, projecting to 30 more days based on last week’s data does seem a little far-fetched. That is one of the primary reasons why you want to run these projections on the regular.
Example: You’ve made some major changes in the last day or two and you want to know how it will impact things.
Answer: For this timeframe, you still want to look at how this new type of performance will roll out into the coming weeks. Instead of assuming that a 7 day range will guide you, use a smaller period of data. If you’ve only got 3 days of “new” performance, you’ll still project how that trend will affect your end-of-month goals.
Caveat to this approach: The less data your projections are built on, the less stock you should take in them. If you’re projecting 30 days based on 3, you’ll want to reassess once you’ve gotten into the 7-day and up range.
Example:
I’m worried that this isn’t an accurate way to predict performance. Can I look back at my projections from earlier in the month and prove they were right?
Answer: That’s a great question- Can you draw from your early-month projections and see that they did, indeed, ring true? Although there are a lot of assumptions made about how performance may remain constant, the theory is that yes, you can.
Caveat to this approach: The goal behind projections is to better identify where you’ll need to change gears in order to reach your goals. If you’re projecting a high CPL, you’ll spend the coming days and weeks making changes to improve your spend efficiency. In this case, your projections had better not look the same from week 1 to week 4, or else you’ve failed to fix the problem. Instead, pulling weekly (or semi-weekly) projections as you make these changes will give you better and better ideas of how much incremental improvement your most recent changes have made.
Now that you’ve got a solid grasp on the benefits of and process for projecting your performance, give it a shot in your account and let us know just how useful this routine task can be!


