In an Auction Insights report, there are six statistics given to you regarding your competition. As most readers know, they are as follows:
Impression Share – How often the participant receives an impression in the same auctions that you are eligible.
Average Position – The average placement of a participant’s ad when they receive an impression on the auctions you are eligible.
Overlap Rate – How often a participant’s ad received an impression while you also received an impression.
Position Above Rate – How often a participant’s ad was shown above yours when both your ads were shown.
Top of Page Rate – How often the participant’s ads show at the top of the page in the auctions you are eligible.
Outranking Share – How often your ad showed above the participant’s ad or showed when the participant did not show at all.
When doing an analysis of the data, the outranking share portion of the data seems to be the most important area. However, this data is somewhat flawed, as it takes the number of times you show above your competitor plus the number of times you show an ad and your competitor does not/the amount of auctions you are eligible. So, this number will always show to be lower than your impression share number even though it is not guaranteed that the competitor showed above you in those auctions where you missed out on an impression.
Example:
You have 70 impressions and your competitor was in 10% of auctions you are eligible. Your impression share is 70%, so 30% of auctions you are not showing an ad. Your competitor in this instance is showing in 10% of the auctions overall, and your competitors Position Above Rate is 0%. Let’s go ahead and say your competitor was in the same auctions as you. So, the auctions overall look like this:
60% of the time: You show, competitor does not
10% of the time: You show above the competitor in the same auction
30% of the time: Neither you or the competitor show
In this instance, your Outranking Share per Google would be 70%. Even though in the 30% lost impression share, neither you nor your competitor showed an ad, and in reality, this is probably not the competitor preventing you from showing an ad.
This caused the Hanapin team to bring in a new statistic to the equation: Rank Above Share. Cassie Oumedian spoke on this statistic in a recent webinar on Auction Insights.
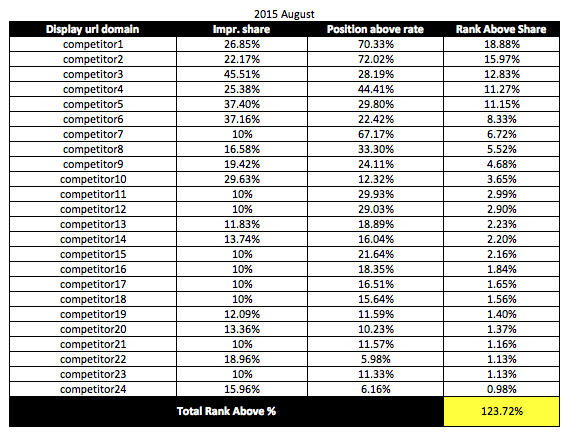
What I typically like to do with the data given in Auction Insights is to use the data to come up with who your true top competitors are in your auctions. In order to do this, I typically look at Impression Share x Position Above Rate, or as we are calling it, Rank Above Share. The Position Above Rate gives the best estimate as to how competitive the participant can be when you enter the same auction. When you both show, how often is their ad above yours? Impression Share shows how often the competitor forecasts within the auctions your are eligible. When multiplying these together, this should give you a fair estimate as to how often the competitor is showing above you on the auctions you are eligible. An example of this can be seen here:
In the example above, Competitor 1 is in 26.85% of auctions we are eligible. On average they show above us 70.33% of the time (the assumption is being made that this % stays constant when we are competing in auctions and we are not showing, or they are not showing in the auction). When multiplying the two numbers together we can show that out of all of our auctions that we are eligible, Competitor 1 shows an ad above ours 18.88% of the time. This takes impression share and aggressiveness within auctions (position above rate) both into consideration in order to find the competitors “Rank Above Share” in our eligible auctions. The 123.72% of total rank above % across all competitors shows a projection that 1.2372 competitors rank ahead of your ads per auction on average.
Let’s look at how to use this data to explain competition month-over-month or year-over-year:
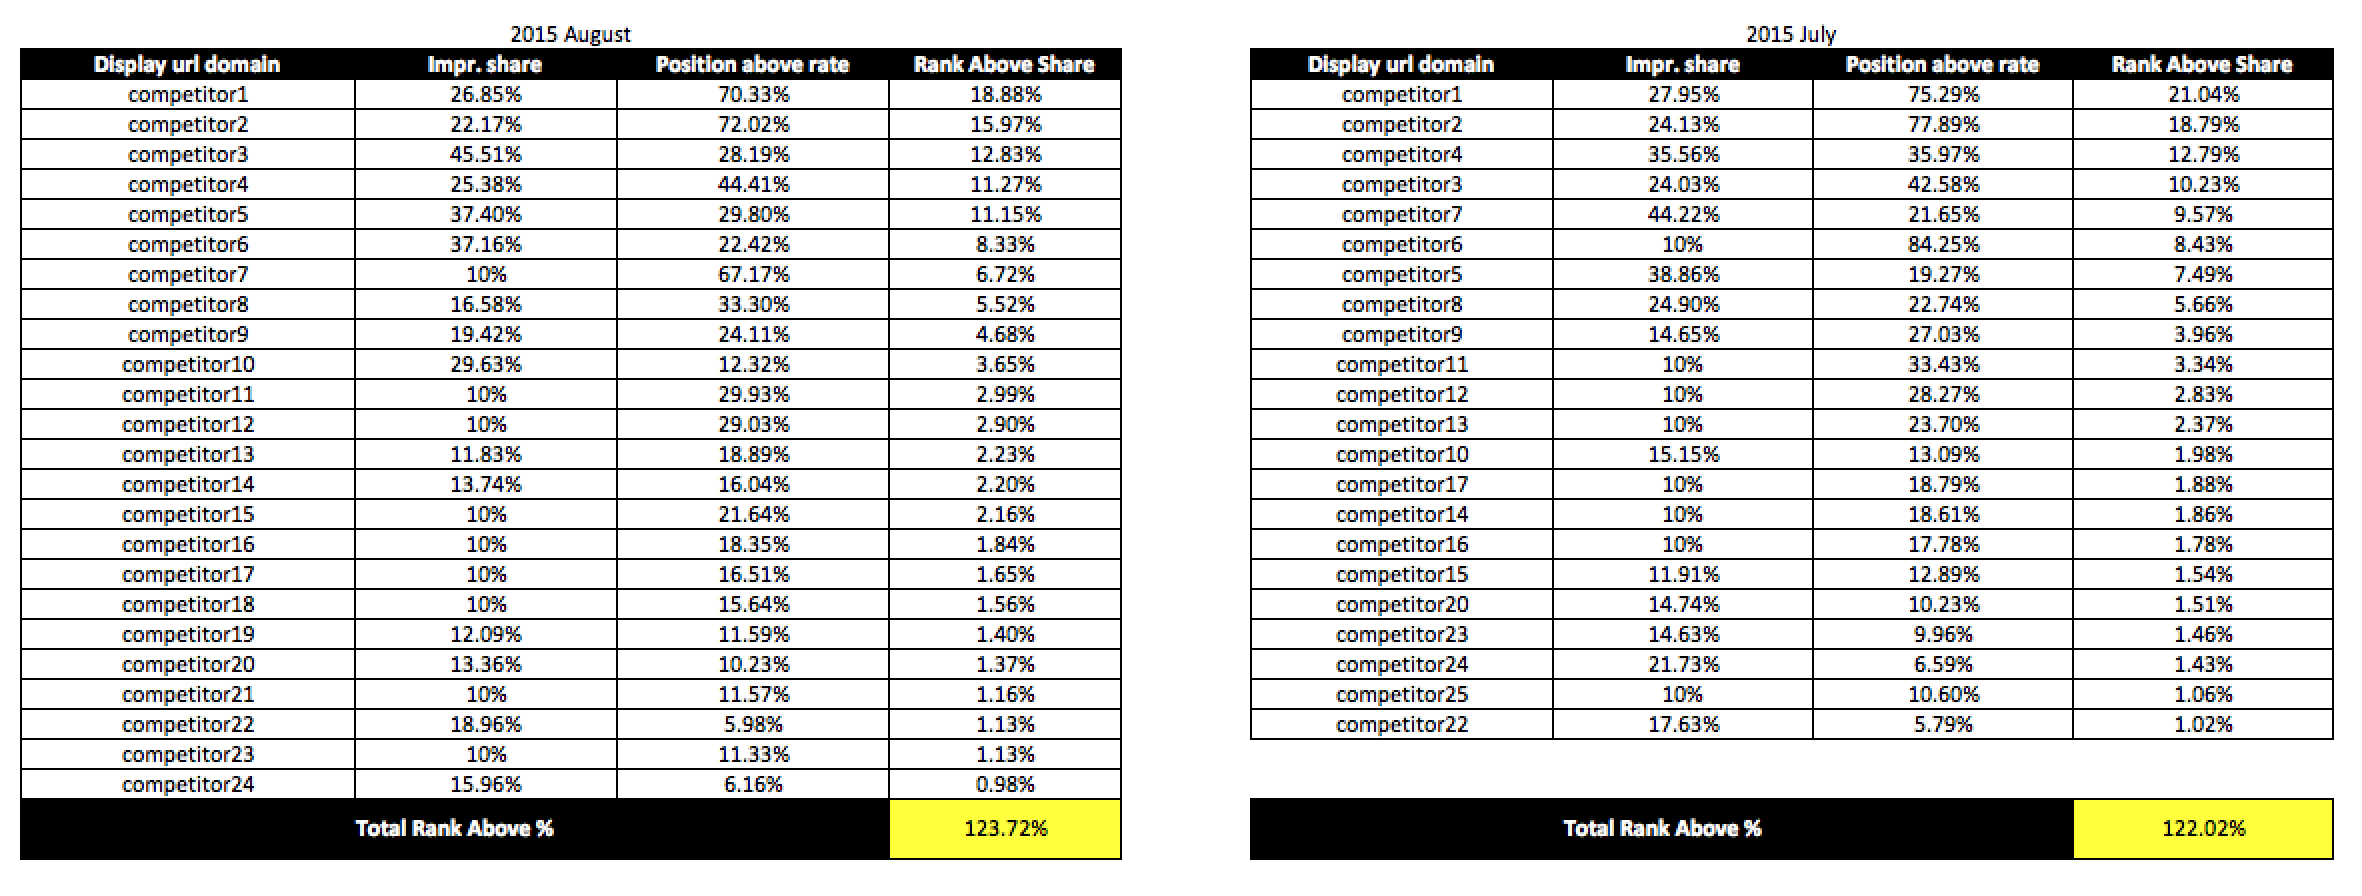
In the example, we can see that the total rank above % is fairly even month-over-month. However, new competition has entered the auctions in August. In July, competitor 1 and competitor 2 had rank above share numbers of 21.04% and 18.79% while in August those dropped to 18.88% and 15.97%, showing we increased aggressiveness while these competitors may have dropped bids. You can see that the impression share and position above rate dropped among the top two competitors. A few of the other competitors seemed to have gotten more aggressive as seen in the chart, and more competitors were added to the mix, causing the total rank above % to slightly go up. This trend helps explain why our impression share may have dropped slightly, or average position may have gone up in this scenario.
We then can put a plan in place to react to the increased competition, including:
- Bid changes
- New ad copy
- New landing pages
Finding who your true top competition is, along with the rise or fall of competitors month-over-month or year-over-year can be key to understanding the success or lack thereof for certain areas of your account. Auction Insights should be the first place one looks when they see large week-over-week, month-over-month, or year-over-year traffic discrepancies.
In the visual, you can see that the competition is fairly balanced. This shows that the playing field is fairly level and with a little more aggressive bid changes here and there, or more optimizations in order to raise quality scores, you can get a leg up on the competition and increase the amount of impressions and improve the placement of your impressions in order to bring more clicks that leads to more conversions or revenue.
Conclusion
Rank Above Share is the best statistic to use in order to find who is the biggest threat to taking your traffic, as it shows what competitors bid within your auctions the most (impression share), along with what competitors can keep up in rank with high bids and quality scores (position above rate).


