Google Analytics provides a cornucopia of statistics. Some are the turkey and mash potatoes to your Thanksgiving dinner, and the others are the potluck sides that may go under-eaten.
I’m calling these less utilized metrics “Random,” because they are statistics that you may not monitor on a consistent basis, and you may not even know how to use them. I’m a firm believer that if you can track it, you can optimize with it. So let’s talk about some ways to use theses random metrics in Google Analytics to create deliberate results.
Content => Site Speed
A few months ago the Analytics team announced that they had added a report to help track page load time. The only problem was, you had to create and implement a new tracking code. They have now, after many requests I am sure, updated this report so you no longer need to add that new code.
Here’s what the report looks like:
If you have a long load time, reducing it will help improve results in a few ways. One is that it should help your quality score. We all know this will help you win more auctions at a lower cost. You will also reduce your bounce rates because people will find what they are looking for faster and stick around. More people sticking around, should lead to more conversions.
Traffic Sources => Sources => Referrals
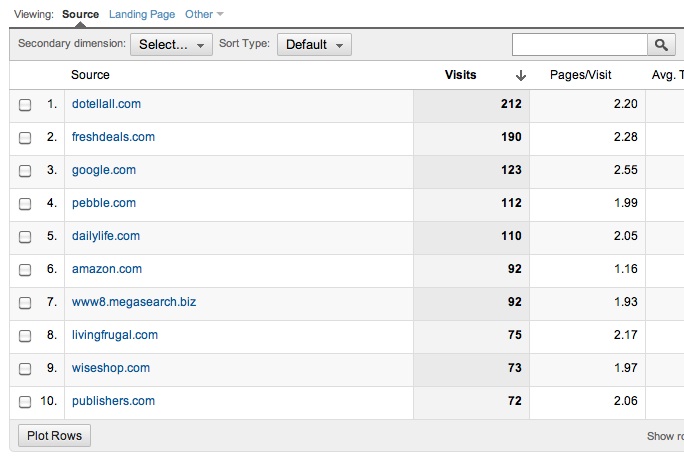
Some of you will already be watching this closely. For example, an affiliate marketer will get most of their traffic via this source. Others, those who get most of their traffic through PPC, may overlook this metric.
It tells you where your visitors when they found a link to you. If you have a referral source that provides a high percent of your traffic you may want to reach out to them about advertising on their site. Or maybe they have written a blog post about you and should make sure to thank them. Here’s an example of this report:
It also tells you how many people are coming from Twitter and Facebook. This tells you if your social marketing efforts are working, or if you need to reevaluate your strategy. And thanks to Twitters t.co link shortening service, you know can use this report to track down the exact tweet that generated traffic for you.
Mobile => Devices – Ecommerce Segment
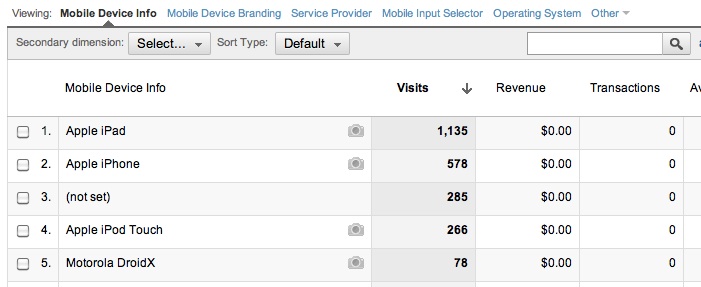
Mobile Devices is a relatively new report, and one that is likely to get more tweaks as Mobile becomes a larger and larger portion of paid search revenue for Google. This particular report will tell you how much revenue you generate from all Mobile Devices that hits your site. The following example is from a lead gen client, because we don’t post our clients revenue numbers, but it gives you an idea of what it will look like for an Ecommerce site.
You can use this report to exclude mobile devices that drive a lot of traffic but little revenue from your PPC campaigns. Or if you have a device that performs well, you can create specific campaigns and landing pages that target those users and will increase traffic/conversions from them.
What random metrics do you measure in Analytics to create deliberate results?


