Google publicly rolled out demographic targeting for search in the fall of 2016. This feature allows advertisers to segment data and adjust bids based on gender and age estimates of users.
The one downside is the “undetermined segment.” This segment can make up a large proportion of the traffic. This can make some advertisers wary of the demographic information, “do we really know enough to make adjustments here?”
Not to mention these are estimates, anyone whose seen Google guess their age knows it can be pretty far off. Regardless of accuracy, if these segments show meaningful differences and contain enough users, it’s worth incorporating into your tactics though.
Today we’ll focus specifically on match rates by age and gender as well as action.
The Data
The data was collected from 80 enterprise accounts spending somewhere between 20k/month to 600k/month. All accounts ran continuously over the period without any major changes in spend levels.
All data was pulled from the Gender Performance Report and the Age Performance Report. If you are interested in trying this for your own account(s) you can access these via the API and though Google Scripts reporting function.

Are Match Rates Increasing?
Have match rates changed over time? Is the system matching more users or are we stuck at the same levels?
We will start by looking at impressions to see if we can use demographic information to control who sees our search ads.
Gender
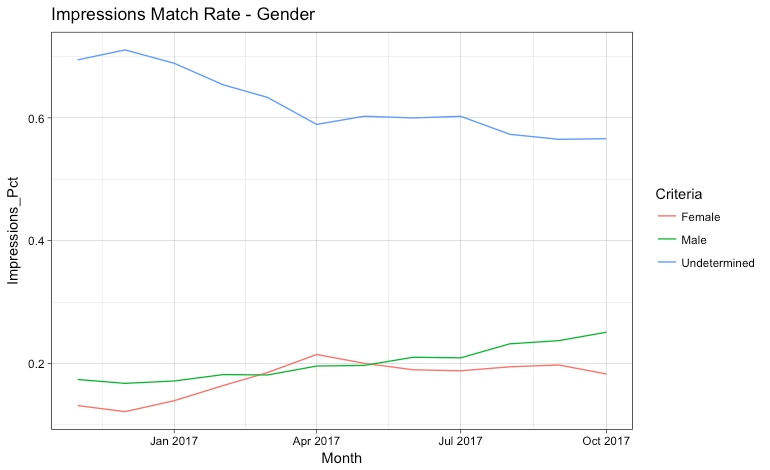
In regard to impressions, match rates have moderately improved over the year.
Last fall, undetermined matches made up about 70% of impressions, by October 2017 that rate fell to the upper 50s. We can expect to adjust by gender for a little less than half of users.
Age
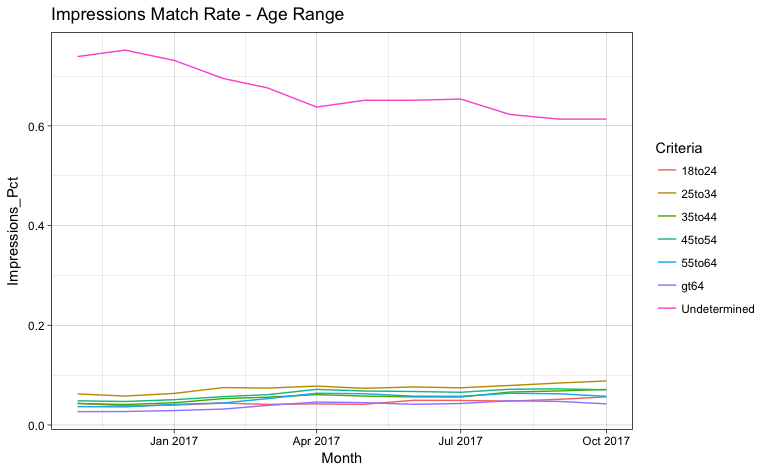
We see the same trend in age range matching. Undetermined matches started in the mid 70s and fell to about 60 over the year. Compared to gender, we’ll have less influence strictly targeting by age range. But 40% is not terrible either!
Does Match Rate Vary by Action?
We started with impressions and found increasing match rates over the year. Does the same trend hold across clicks and conversions? You could hypothesize that taking a positive, measurable, action would increase the classification rate.
Let’s see if we find that in the data as well.
Clicks
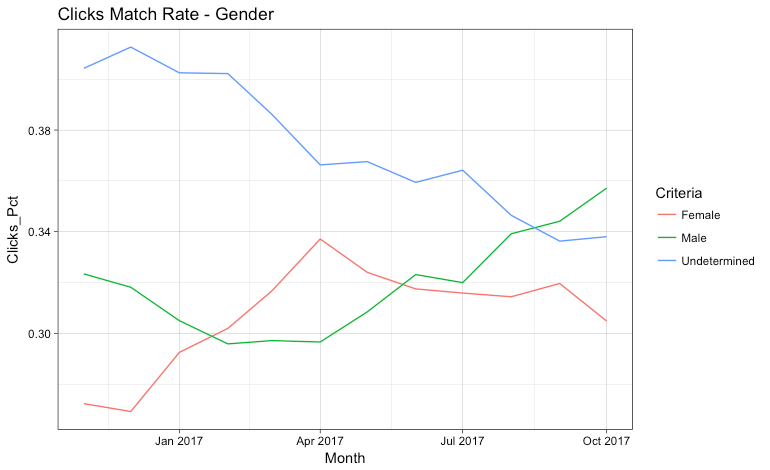
Matches to clicks improved, just like impressions, but the change in matches to clicks was less dramatic than impressions. This is due to clicks having at a much higher match rate from the start.
Gender was the less dramatic of the two. Unmatched rates declined from about 40% to 34%. This means two thirds of click activity can be associated with a gender. This is much higher than the impression match rates we examined in the last section.
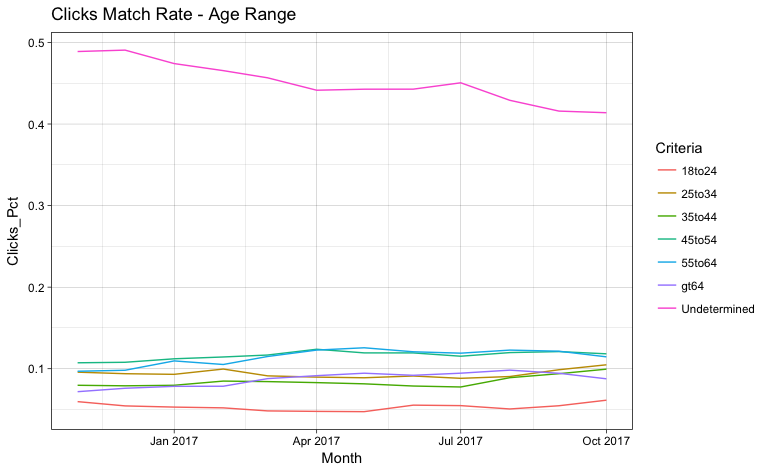
Agefalls behind gender in terms of matches. There were larger improvements though in terms of total volume. Last fall, less than 50% of clicks went unmatched to an age range compared to about 41% by the end of 2017.
Conversions
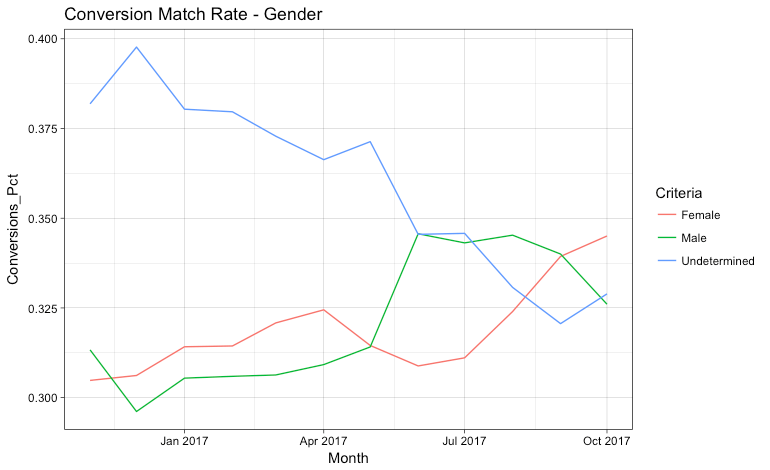
Match rate by conversions is similar to click match rates.
As with clicks, gender was the less dramatic change and unmatched rates declined from about 37% to 32%.
Conversions did not show a huge change either but unmatched activity trended down to just under 40%.
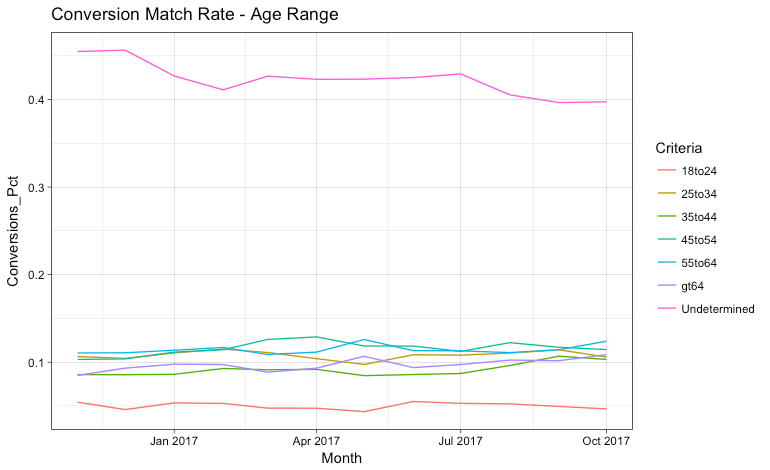
The answer to “does match rate vary by action?” is yes! At least in terms of users who saw the ad versus users who performed an action. Once we compared clicks versus conversions, we found the unmatched rates were not dramatically different. This does not necessarily have a huge impact on the tactics we approach but gives us an idea of how many users who interacted with our ad or site can be matched.
Are Rates Increasing Across All Devices?
Match rates are increasing across the board, but is this for every device or is the effect driven by changes in specific devices?
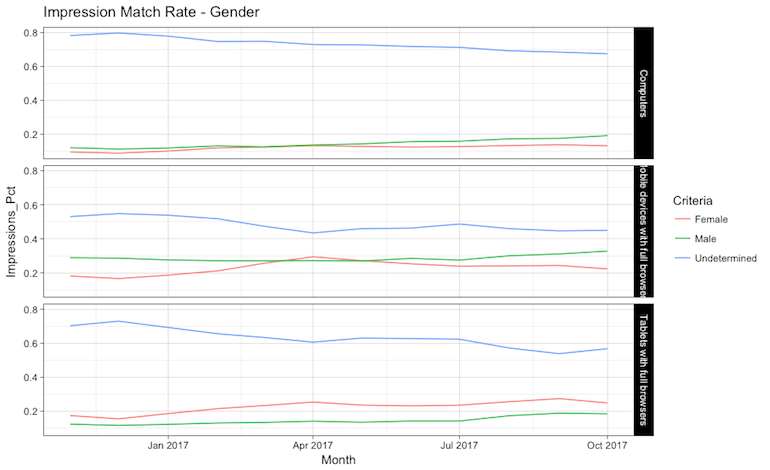
Gender shows an immediate disparity in terms of match rates. Over the year the undetermined match rate fell to 26% for mobile. On desktop it never went below 42%. All devices showed improvements over the year but mobile started with a major lead, at 30% unmatched compared to 50% unmatched on desktop! Except for the late fall, match rates for male and female were always higher than undetermined.
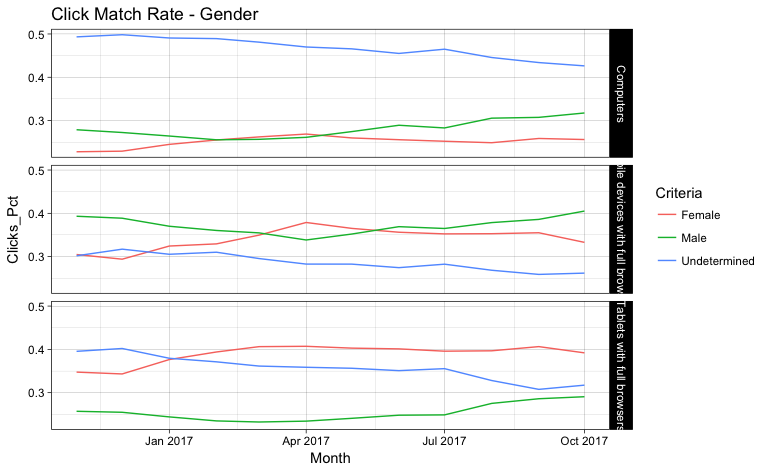
We could expect mobile traffic is a significant contributor to the changes we see at the aggregate level as users rely more heavily on mobile phones. Matching is probably easier to as it is the go-to device and users probably keep their logins active across apps and services.
The variation in age range is less dramatic but follows the same trend. Mobile has the advantage but it is a much smaller margin compared to the binary gender distinction.
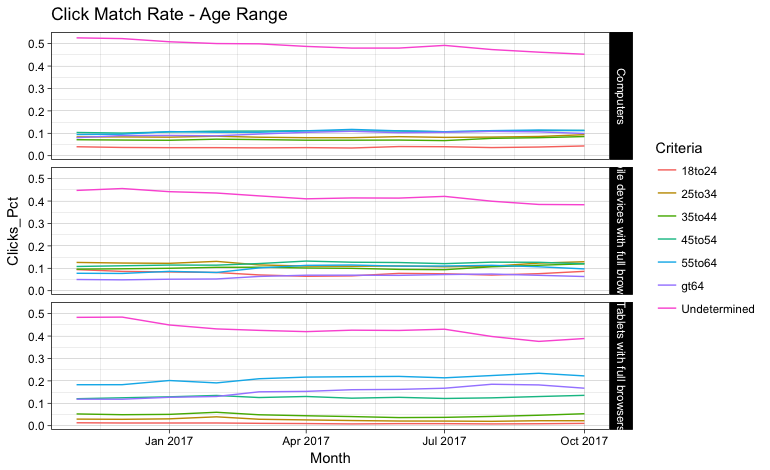
We’ve seen that match rates in general are lower for desktop and lower for impressions across the board. One interesting detail is that as mobile match rates are much higher for impressions. Desktop is a little below 70% unmatched while mobile is in the mid 40s!
Remaining Questions
We found match rates increased for both demographic segments, age and gender. This means we can potentially rely on this feature more and more for tweaking bids and targeting. While it’s rudimentary it’s a great start towards audience based targeting and utilizing more refined tactics.
All of this analysis was in aggregate though and we can expect different results based on accounts, goals, locations, and other targeting options. Beyond diving into specific accounts, there are a few more ways we can segment the data for future analysis.
- B2B versus B2C accounts
- Lead gen vs. Ecommerce
- Time – Hours of Day, Day of week
All of these require a different data set than what we have now. That said, if this turns out to be interesting there may be a follow up post to this one!


