As an account manager of a handful of e-commerce clients, return on ad spend (ROAS), is the key metric I look at to optimize my accounts. Of course, return on investment (ROI) is even better, but it’s not often, at least in my experience, that you get a client with access to their product margins and overhead costs. I normally get a loose estimation of these things, and we work out a goal ROAS together. With, of course, increasing volume being the goal of equal or greater value.
So, to meet this end, I’ve started using a custom report in Analytics that tells me all of my AdWords information, shows me conversion rates along the conversion funnel so I can easily identify areas to concentrate optimization efforts, and shows me REAL ROAS figures. If your site charges shipping and/or tax (you are legally require to charge tax at least to those customers in your company’s state), and you’re just using the top-line revenue numbers to figure your ROAS–you’re doing it wrong! You need to factor out shipping and tax costs to find your actual product revenue. There are some sites that use shipping charges as a way to get a bit more profit, so make sure to discuss that with your client to see if you should attribute any revenue to the shipping charges.
So, here’s the how-to: first of all, you need to have e-commerce tracking and conversion funnel goals in place. If you need help with setting that up, check this article out.
I use four different tabs for my report, so create these four tabs with these metrics and dimension drilldowns:

So, let’s go through these tab by tab:
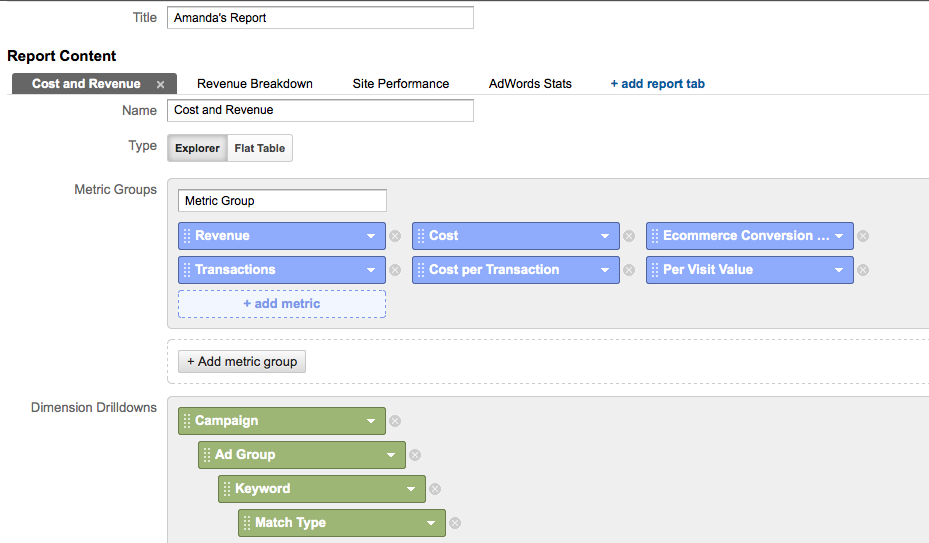
1. Cost and Revenue
I use this tab to get a quick & dirty look at cost versus revenue numbers by campaign. Like I mentioned before, this revenue number isn’t factoring out the shipping or tax, but again–quick & dirty! It gives me a quick glance to to see which campaigns are looking shabby. You can click the campaign that’s crappy to see the ad groups that are crappy, and click the ad groups to see the keywords (this is the point of the dimension drilldowns).
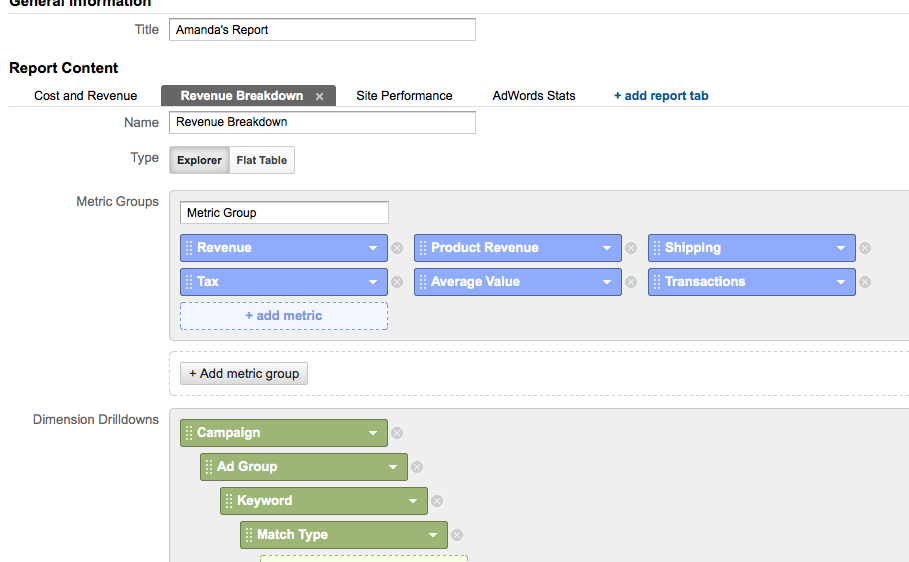
2. Revenue Breakdown
I use this tab to get the real ROAS. Factor out that shipping and tax, or you’re basically just lying to the client. Again, keep clicking through the dimensions to find the areas you need to concentrate on optimizing or find the areas that are great so you can duplicate their strategies.
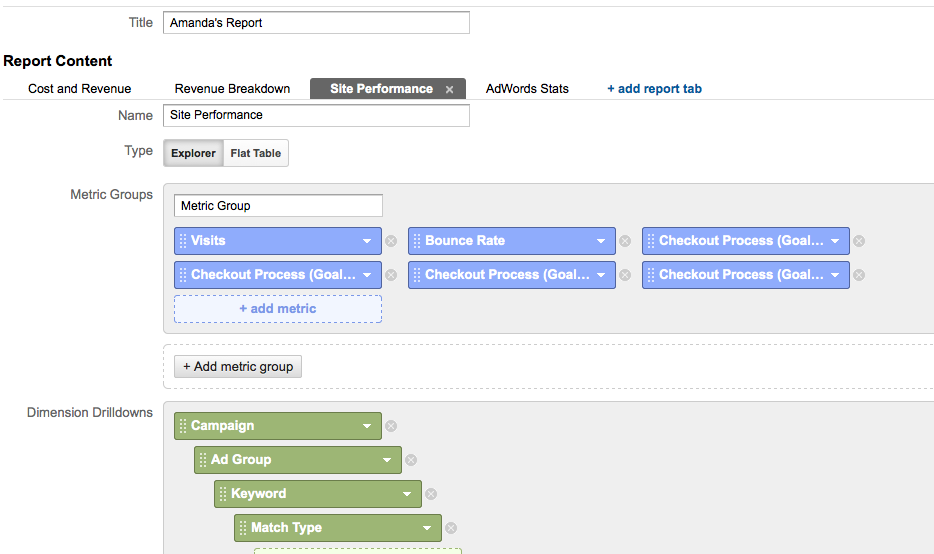
3. Site Performance
This tab helps me further hone in where to make my optimizations. Here, I can see the percentage of people who visit that add something to their cart and the percentage of people who add something to their cart and actually purchase something. This helps me figure out if people are getting turned off somewhere in the check-out process or if they just hate the landing page. So, by now, you’ve done a quick down and dirty analysis of which campaigns/ad groups/keywords need help, you’ve figured out the real ROAS to make sure you’ve got the bad seeds, and now you’ve focused in the problem by finding where in the conversion funnel people are getting turned off. If you’re not seeing anything alarming in this tab–great!! Your problems are somewhere in the last tab.
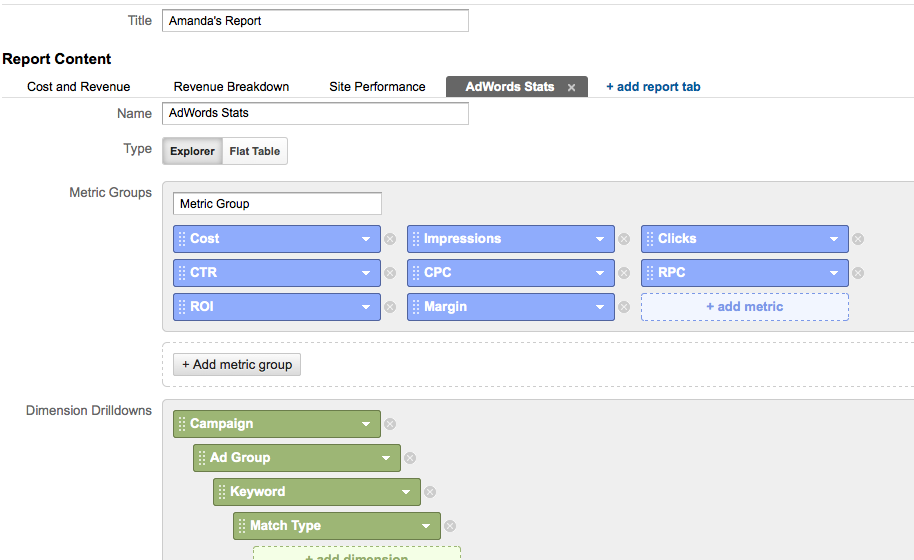
4. AdWords Stats
With this tab, you can find out where your CPCs are for your identified crappy campaigns/ad groups/keywords and all of your AdWords metrics. This will hopefully help you identify where you can make some improvements in you AdWords campaign to better your ROAS.
So, there you have it–my Analytics custom report, how to make it, and how I use it for increasing e-commerce ROAS. Now, tell me if I’m missing anything! Or, how would/do you do this report differently?


