One of the problems I had been having this month came down to the issue of optimally efficient budget allocation. For some of you out there, this won’t be something you’ll ever have to worry about, but for a couple of my accounts, we have to maintain a rigid budget that we can’t go over. With lots of lost impression share out there, one of the easiest ways to let computers rule your life do the hard work of deciding where to spend said budget, is to use the Excel Solver.
Before we go any further let me add a couple of caveats. First, if you are consistently budget limited, you might consider using lower bids to maximize the number of clicks you get within your budget, rather than just changing around you daily budgets. Second, I’m using a Mac and Excel 2011 to show you this – it runs a little differently on every version of Excel but most answers on where to find specifics can be found using Google.
Getting started – finding Solver
Not all of you will have Solver installed on your version of Excel. In my case it was already installed and located on the ‘Data’ tab of my ribbon.
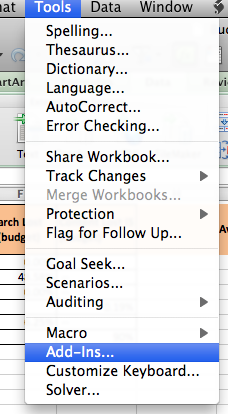
To add it, go to your Excel options and select ‘Add Ins’. From here you should be able to find the Solver plugin and set it live. Here’s a link to the Microsoft Office instructions for how to get it running. On Mac you should find it in the ‘Tools’ menu (see picture):
Optimizing those budgets:
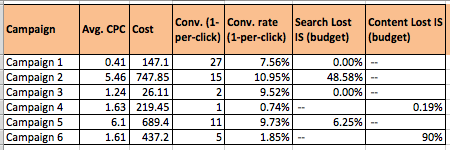
Now we have the general housekeeping out of the way, let’s move onto using Solver to give you some awesomely optimized daily budgets. The first thing you’ll need to do is download a campaign report from AdWords that includes columns for Avg. CPC, Cost, Conversions, Conv. Rate, and Lost Impression Share due to Budget (Search, Display or both depending on which types of campaign you have). I typically use 30 days of data – you can go with more or less suited to your need, just remember to be consistent when working back to daily amounts later on.
Hopefully you now have something in your Excel that looks like this:
What you need to do next is add the columns you need as part of your Solver equation. These will be:
- Average daily spend
- Maximum possible daily spend
- Solved daily budget
- Solved daily clicks
- Solved daily conversions
You will also want to add total cells at the end of your ‘Max Possible Spend’, ‘Solved Budget’ and ‘Solved Conversions’ columns (see examples below).
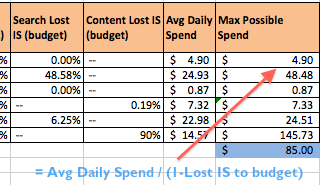
Here I’ve added my avg. daily spend by dividing my cost column by the number of days my data spans (=Cost/30 in my case), and then worked out the maximum possible spend using a function of my existing spend amounts and my impression share lost to budget.
This isn’t a perfect way to calculate the maximum a campaign could possibly spend, but it is a good approximation. It takes our current traffic level, and back fills in the rest of the traffic we are cutting out due to lost data.
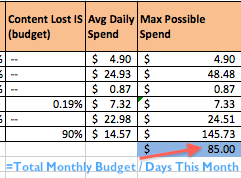
If you notice my total cell for the ‘Max Possible Spend’ column isn’t the sum of that row, but rather my maximum allowable daily budget. In my case, this client has a monthly budget of $2,500, so the daily total budget is $2,500/31 = $80.65. You’ll notice I rounded up to $85 – this is to mitigate the fact that some days will naturally be down in the month, and so I want to add a little headroom.
Now we move onto our ‘Solver’ columns. These are the columns that the Excel Solver is going to ‘optimize’ for us.
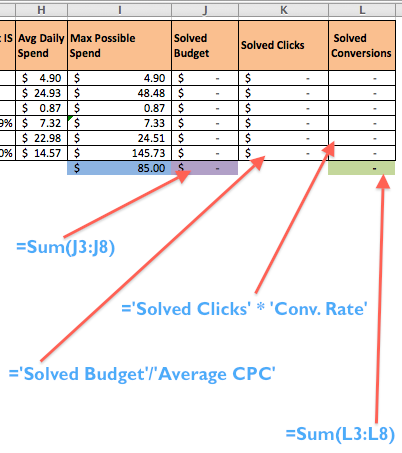
Solved Budget refers to the budget solver tells us is the optimal breakdown – this is the data we will feed back into our AdWords campaigns. For now, leave this blank (or put any random numbers, it doesn’t matter). Make sure to add a total for the Solved Budgets too.
Solved Clicks will take the new campaign budgets and divide them by our existing average CPC in that campaign. We then take this Solved Clicks data and multiply it by our historic conversion rate to get our new number of ‘Solved’ conversions. Again, this makes some assumptions about CPCs and C/Rs remaining steady, so if you see lots of fluctuations be a little wary of this methodology.
Finally we need a total solved conversions cell – this is the cell we actually solve. If you think about it, the whole point of this exercise is to work out what allocation of daily budgets will get us the highest number of conversions without going over our total budget. Use a sum formula for the Solved Conversions row to calculate this.
If that was a little unclear, I’ve pointed out the formulae to use in the image below:
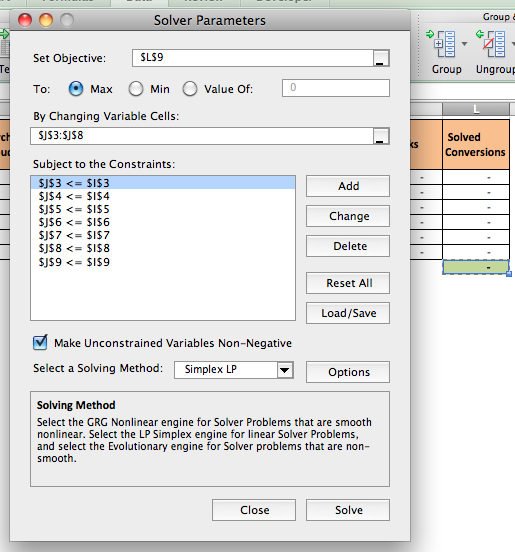
Now you should be ready to use the solver. Highlight your total Solved Conversions cell (highlighted green above in row L) and hit the big Solver icon. You should see the solver options open up like so:
In this case our objective is to get Excel to generate the maximum possible value in cell L9. There are plenty of other uses of Solver to do cool things which might involve specific numbers you have to hit, or generating the minimum level of something – see this post by Microsoft for some more ideas.
The variable cells in the above table refer to our ‘Solved Budget’ row. We are letting Solver change the values in those cells until it generates the most favourable number of conversions.
However, left to do this without any parameters it would tell us to set infinite budgets and generate infinite conversions (unfortunately PPC is a cruel mistress and doesn’t work that way). This is where we need to input the constraints of our equation:
- Our ‘Solved Budget’ must be equal or lower than our ‘Max Possible Spend’.
- The total Solved Budget cell must be equal or lower than the number we inputted into our maximum possible spend total (in my case $85).
Do this by going one row at a time and setting your constraints – for accounts with many campaigns this can be kind of a pain, but I haven’t figured out a quicker way to do it yet – feel free to share if you have.
EDIT: You can just drag down the entire selection of cells you want to be less than or equal to and then drag down the other column to save time.
The final piece of the puzzle is to set our solving method to ‘Simplex LP’ – (learn more here). Once you have all of that set, go ahead and hit the big shiny ‘Solve’ button. Depending on the speed of your machine and the complexity of your table, this may take anywhere from a few seconds to a good number of minutes.

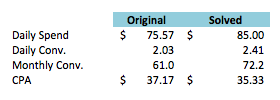
I like to sense check my results by making sure that my new conversion numbers are actually better than my old ones. Build yourself a mini table like this to be sure:
As you can see everything looks good – my new budgets should give me a small boost in CPA and daily conversions.
If you have any questions, or want to share other cool uses of the Excel Solver feel free to leave comments below or catch me on Twitter @SamOwenPPC. I’ll also be posting a video in the coming days to go over this for those of you who are still a little unclear about the steps involved.


