Looking for ways to expand your account? Who better to look toward for insight than Google itself? Google Insight is a tool, which, much like Google Trends, shows trends in searches. Google Insights is, however, more directed toward researchers and advertisers with it’s additional data and features. Beyond the information that is found in Google Trends, Google Insights also shows you the keywords along with increasing or decreasing search trends for the topic.
Google Insights is insanely easy to use. Type in the keyword you are interested in, select a country, (and, hey, even drill down as far as state or city) and a time frame and hit search. If you would prefer, your results can be based upon time frame, or by region, instead of making the search term the main focus. Insights will then spit out the breakdown of searches by category, as well as the regional interest data for the term. You can
break up this data by ‘Forecast’, a graph, or ‘News Headlines’, which is pretty straightforward. Furthermore, you can click on either the category, or the location of regional interest to see the top search terms and rising searches for the term.
How Does Google Insights for Search Work
Google Insights analyzes actual worldwide web searches via Google, from all domains, in order to calculate the number of searches that have been done for the terms inquired, relative to the number of searches for the terms over time. You can narrow down data by region or time frame and can also choose to see data for select Google properties, including: images, web search, product search, and news search. *Note: Not all categories are yet available in all locations.
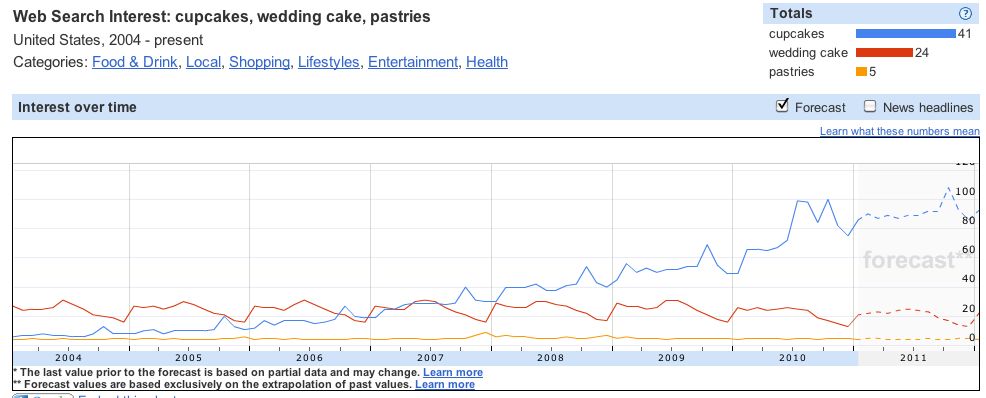
On the results page you will see a graph with the search volume, which lays out search volume (or interest) over time, for the terms you have entered. The graphs are scaled from 0 to a 100 with the totals next to the bars by the search terms. Check out this article, to read about how Google normalizes Google Insights data.
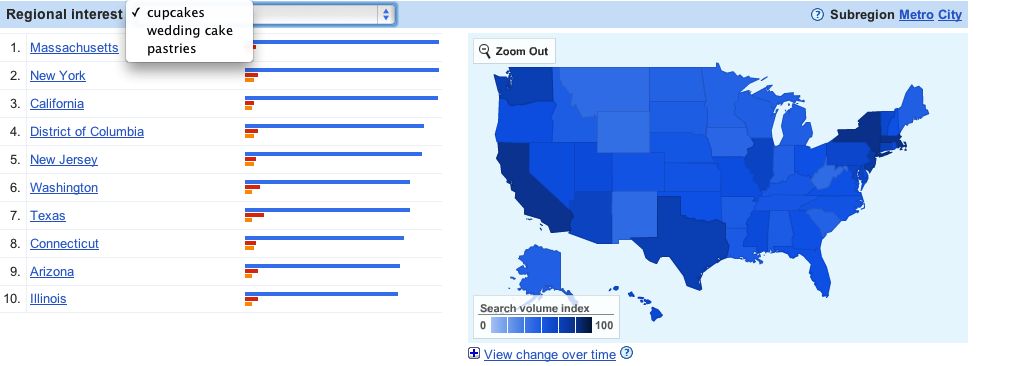
Below the graph, you can see the top regions, which, by being clicked, will be further broken down into cities. If there are several terms being analyzed (the max is five), you can toggle between terms to see which locations have the highest search terms for each, with comparisons to the other terms that you have entered. Alongside the list of regions, you will see a world heat map which geographically displays the search volume index with defined regions, cities, and
metros.
Further below the regions, you can see search terms including the terms that currently have the highest number of searches, as well as the search terms that are currently increasing in volume. Again, if you are analyzing more than one term, you will need to toggle between the terms.
Above the graph, you can find a breakdown of how categories are classified with an approximated percentage. By clicking on a category, you can then see the same graph with the relative interest rates and forecast, as well as the regional interest and search terms. You can further breakdown the categories into subcategories for a deeper dive. There, you will see the same metrics including a graph, top locations, and search terms. Google defines this data by aggregating IP address information from users’ logs in order to make educated guesses about where search queries originated.
How Can Google Insights Help My Account?
Looking at the top search terms and rising searches helps with well-rounded keyword research for not only keywords that are already heavily used but also for those that are on the up and up.
Insights can help you select advertising messages. In example, a baker working to determine which of the following would resonate best: fuel ‘cupcakes’, ‘wedding cakes,’ or ‘pastries’ to market their services.
Insights can be used to determine seasonality. For instance, resorts, wedding-related retailers, or holiday items, may benefit from knowing which terms are highly seasonal. If the results are fairly consistent over years, then you will be able to anticipate peaks and falls in demand, and budget accordingly.
Entering into new markets is also made easier by Insights. This is perhaps the most fascinating to me. By looking at regional data, you can determine which markets currently have a high demand (search volume) for your product. If feasible, you can begin to campaign in these markets in order to globally increase sales.
Furthermore, by looking at regional data, you can select keywords individually for each region. For instance, Massachusetts has high search results for ‘cupcakes’, whereas Louisiana has high search results for ‘wedding cake’. Moreover, the term ‘pastries’ was not the highest result in any region. This data can be used to ensure that campaigns and ad text are created specifically toward the demand in regional area. Nationwide, we can see that the searches for ‘cupcakes’ is forecasted to grow, so it may be a good idea to prepare ‘Cupcake Campaigns’ for the entire Nation as it is likely that these searches will continue. Using Insights, you can be sure that you are reaching the largest number of potential consumers as possible.
The Google Insights tool is a great way to look at, analyze, and understand search query data. I think I speak for all search engine marketers when I say that we are always testing, adding, and rewriting ad text. What better way to test ads than with search terms and phrases that are statistically prevalent in the targeted area? On top of that, growing accounts can always use more keywords. Make sure your account includes all of the current top searches as well as those on the rise! Check out the Google Insights tool and let me know what you think!
Has anyone else utilized the Google Insights tool? I would love to hear about your experience, as well as any tips or tricks that you would like to share!
For more information about Google Insights, visit https://www.google.com/support/insights/?hl=en-US.


