I just got an update from my Google rep about the addition of account performance graphs that are going to be added in the next few weeks in the ‘my change history tool’. These new additions will show you how changes you make to your account effect your account performance. “These graphs will give you greater visibility into event causality and arm you with insight into how the changes you make impact your account’s performance,” says Google.
I think this sounds pretty cool and I can’t wait to see how it works. These updates will not only help you keep track of changes you make to your PPC account but they’ll help you better understand how they affect your performance.
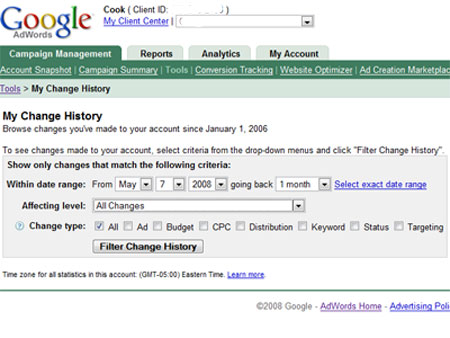
Just in case you’re unaware, the ‘my change history tool’ within Adwords allows you to select a date range, a specific campaign and metrics like budgets, ads and bids and view specific changes that you have made within your account. It’s great if there are multiple people working on an account and you need to know what changes someone has made. But it’s also helpful to see changes you’ve made in your account in case the performance escalates or declines suddenly.
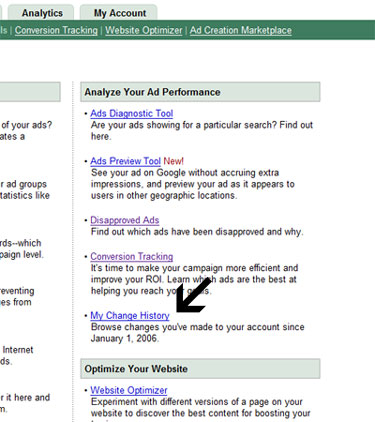
To view changes in your Adwords account, just go to the tools section in the top hand navigation within your Adwords account. Then click on ‘My Change History’ under the ‘analyze your ad performance’ section.

From there you’re able to select your criteria of changes you would like to view.

Once the report runs it will show you the date the change was made, the person logged into the account at that time, the exact change that was made, and to which campaign/ad group.
I will do a follow up post once the new financial reporting is implemented into the ‘my change history’ section of Adwords.


