If you are anything like this guy and myself, your mind has been totally blown with AdWords latest update to the reporting suite that now allows you to apply advanced filters on KPI metrics to compare performance % change trends over a period of time directly in the AdWords UI.
Whether you are an SEM account manager, digital marketing executive or an owner of a company that is pouring dolla dolla bills into your paid search programs, you are always looking for answers as to what, where, and why your account’s performance has changed over a period of time and as always, time is of the essence. For example, you may want to know how that new ad test is affecting CTR? Or, have we seen CVR increase or decrease with the CRO test we are running? This new feature will allow you to quickly compare performance over a period of time and take appropriate optimization efforts based off the information provided.
Below is information from the AdWords blog regarding the newest feature released earlier this week:
“Which campaigns are down this week? How is my performance this month compared to last month? If you’re like most advertisers, you ask yourself these questions on a regular basis. Over the next few days, we’re rolling out a feature that makes it much easier compare metrics across different time periods by putting the data right in your AdWords tables.
This new functionality has been added to many reports across AdWords, on most metrics. All of the additional columns are also sortable and filterable, which makes it easy to answer questions like:
Which campaigns saw the largest increase in clicks?
Which ad groups saw conversions drop by more than 20%
Which keywords saw an increase of at least 100 clicks?
You can also use filters on these columns. This makes it easy, for example, to create a saved filter which finds all campaigns that saw a decrease in clicks of 20% or more.” Posted by David Rodriguez, Product Manager, AdWords
How to View Performance Trends Over Period of Time:
- Turn on “compare dates” in your date selector
- Look for the + sign next to KPI metric columns, for example “Clicks”
- You should now be able compare performance over the selected time period selected

How Apply Advanced Filters Using % Change:
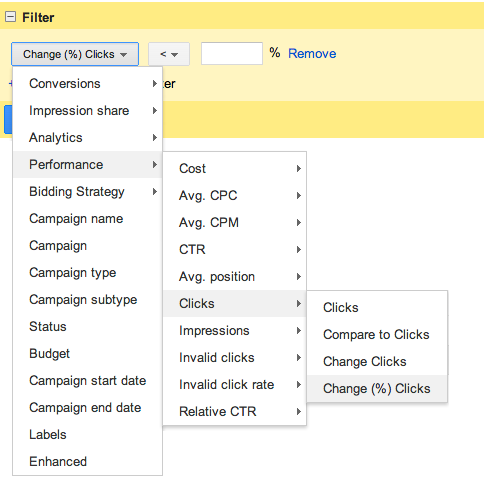
- On the column sets where the + is available, select “Filter”
- Performance
- For Example, Clicks
- Change (%) Clicks
- Select the data to be filtered for example (Change % Clicks < 20%)
- Name and Save the filter
Now What Can You Do With This Info?
- Monitor Bid Changes
- CTR – Ad Copy Testing
- CRO Performance
- CPA Target adjustments
I personally think this is a great tool to take a look at creative testing affects on CTR over a period of time. Instead of having to dump all the info into a pivot table, calculate % change and analyze ad performance one-by-one, you can now get a quick high-level view as to how your ads are performing directly in the AdWords UI. You can also quickly and easily identify large swings in CTR using the advanced filters. For example, filter for ads with CTR % Change > 20% over selected date range.
Some may not find this feature as mind blowing as me but what can I say…it’s the little things that save me time like this that make me happy and blow my mind.
Check out your accounts to see if this new feature is available and let us know how the new compare columns and advanced filters worked for you!


