In my last post 5 metrics I use to measure account success I touched on using Google’s segmentation metrics. Today we’re going to take a deeper look into segments and discuss what they are, and how to best use them.
Why Use Segments in the First Place?
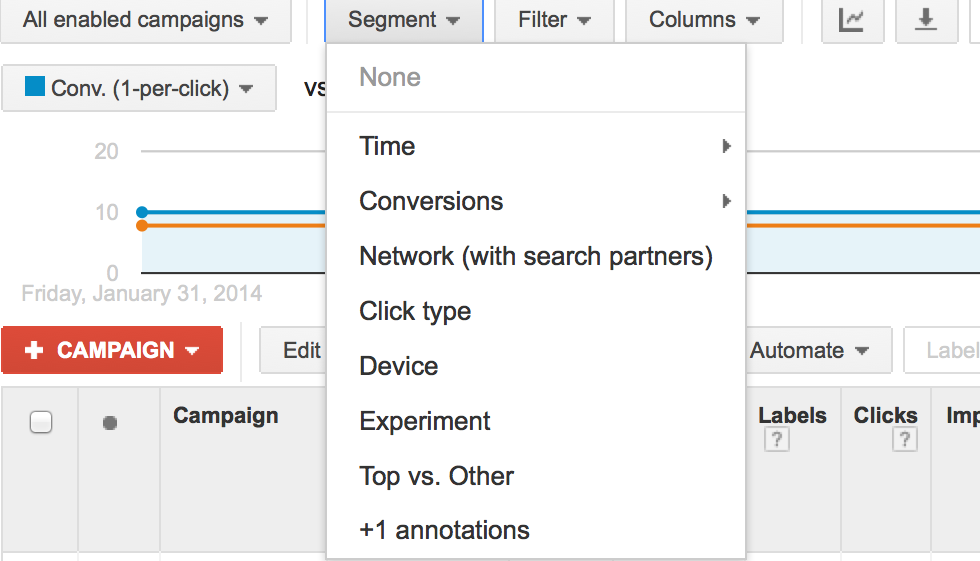
Let’s face it; Adwords is one big blob of numbers. The problem we all face as ppc pros is how to make this big blob of data useful. Segmentation provides the specific insights into how your account is performing under very specific circumstances. Need to quickly see performance by time of day or how ads perform on top vs. farther down the page? Segments provide this information in just a couple of clicks. If you want to gain the deep insights into your accounts performance and take your account to the next level, you need to use segmentation. Segments can be accessed on an account, campaign, ad, group, ad, or keyword level. The screenshot below illustrates how to access this data.
Top vs. Other
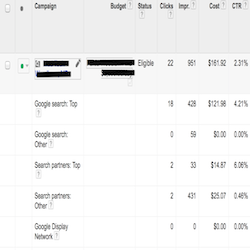
I’ve always been fascinated how ads perform in certain positions on a search results page. While Adwords does not provide performance by individual position, the ‘top vs. other’ segment does provide insight into performance when ads are showing on top of the search results vs. the side or below the results. This segment is also broken down to show performance on Google and the search partner network.
Understanding top vs. other performance can influence your ad position and bidding strategy. I’ve often heard from my clients, ‘we need to be in #1’ position’ or ‘lower position works better for us’. I immediately look at this segment data to confirm whether or not those statements should be translated into actual ad position strategies. Many times the data will tell an opposite story of what you or your clients think to be true. Use this segment and you’ll be informed as to where your ads should ideally appear on the page. You’ll then know whether bidding aggressively to the top of page is required or maybe bidding down to rank lower on the page is the way to go.
Time
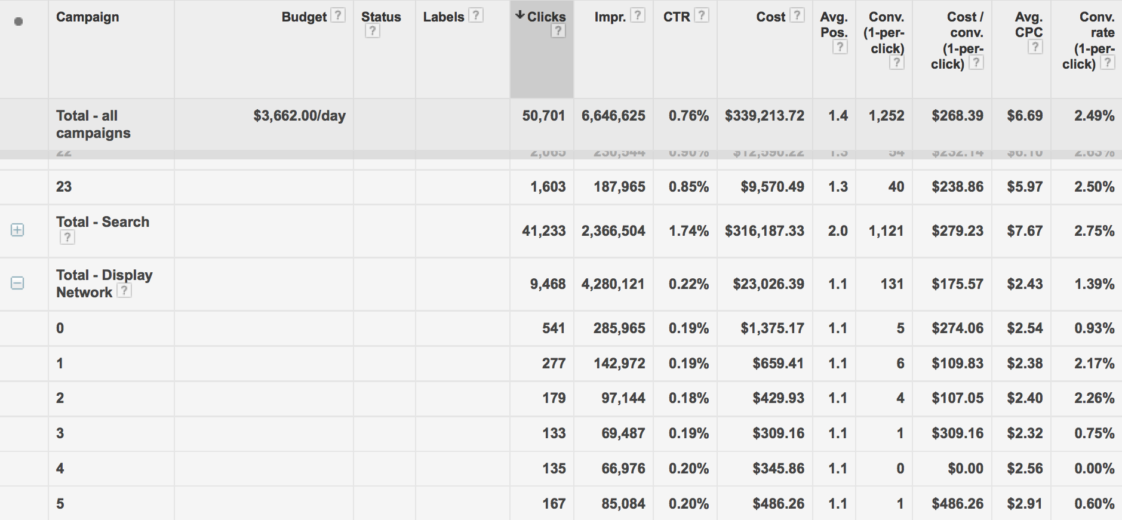
Paid search accounts run around the clock and can spend tons of money at times of the day or days of the week that either under perform or don’t produce results at all. Part of having a healthy account that’s meeting goals is to apply budgets to those hours and days that produce positive results. This is where the ‘time’ segment comes into play. Take a look at the example below. I ran an hour of the day segment for an account I manage. I learned from this that conversions and conversion rate falls off dramatically from 3am-5am compared to the rest of the day. This simple view highlighted the need to either bid down or block ads from showing during these particular hours.
Device
We’re in a device centric world. People are on their laptops, phones, & tablets all the time. We also know that account performance varies widely between those devices.
What I find particularly useful when using the device segment is seeing the variation in conversions and CPC’s for desktop and tablets vs. mobile devices. Understanding this data is key to developing strategies that maximize the efficiency of your paid search advertising across devices. Below is an example breakdown of performance by device type. Note that conversion rate is steady between devices but CPC’s and Cost per Conversion varies greatly.
Network
The network segment breaks down performance on Google.com and their search partner network. While we don’t have the flexibility in Google to separate our campaigns by search partners, at least we can make an informed decision on whether we should or shouldn’t be advertising on the search partner network.
Click Type
Click type breaks down performance by ad section. This metric has grown in importance now that ad extensions are playing a much bigger role in overall ad performance and ranking. Access this data by choosing ‘click type’ in the drop down menu and you’ll see performance broken down when the headline, sitelink, or mobile click to call section of the ad is clicked.
+1 Annotations
Breaking down data this way will show whether or not performance improved when tagging your ads with the Google +1 annotation. This data set is broken down by basic, which shows how many people across the web +1 the landing page and personal, which shows how many people within their circle +1’d the landing page.
Experiments
This segment breaks down overall performance by experiment. Google has functionality to set up ‘experiments’, which are tests that can be set up within Google. Segmenting this data can clearly show whether or not these tests are working and can guide whether an experiment should continue or not.
Conversion Type
Many accounts have multiple types of conversion. This segment can drive some very important decisions on how to allocate budget. For example, a keyword might generate a lot of conversions. However, conversions aren’t created equal. For example, a sale will be worth more than a sign up. Knowing what kind of conversions are being generated will help guide decisions on how to budget or bid your campaigns and keywords because you know what type of conversion is being generated.
Segments are a valuable part of my overall account analysis. It’s not the only tool, but the insights you get can give a whole new perspective on account performance. Tell me about your experiences using segments. What have you learned about your accounts?


