There’s been a lot of talk about site speed in the past year or so and I thought it would be a good time to look into the impact it’s had on some of my accounts.
Over the past few weeks I’ve been helping my clients look into their average page load time and see if we can discover any ways to speed things up as part of a general site audit and quality score review.
The Basics:
Google announced back in 2008 that site speed plays a role in assessing your PPC Quality Scores. Here’s a snippet from that announcement:
“Keywords with landing pages that load slowly may get lower Quality Scores (and thus higher minimum bids). Conversely, keywords with landing pages that load very quickly may get higher Quality Scores and lower minimum bids.”
KissMetrics also recently put together an infographic on the impact of slow site speed on conversion rate – they take their data from thousands of accounts across a variety of industries.
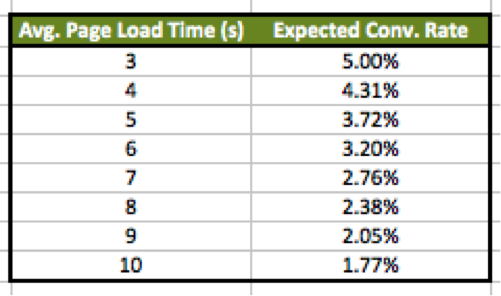
Essentially, for every second it takes your page to load over 3 seconds, you will see a 16% reduction in conversion rate. This means the faster the site loads, the more money you will have to play with and the more you can bid.
Here I’ve put together a quick run down of what to expect for a site with a 5% conversion rate when running at optimal load times.
As you can see, once you hit 8s load times, your PPC is already running at half of what it could be.
How Fast Is Your Site?
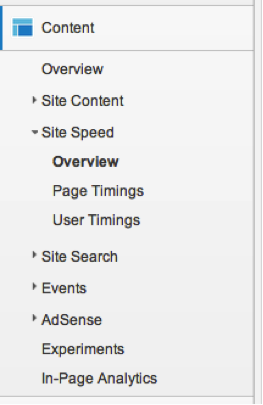
Start by working out exactly how fast your site is. There are two main tools I use to do this for my clients. The first is Google Analytics.
I like to look over the past 12 months for a snapshot of my average page load time. Make sure to set your intervals to monthly to get a nice looking graph like this:

This helps me get a feel for how my account is looking – whether there have been any spikes recently and whether things are generally getting better or worse. You can see in the example that nothing jumps out recently to suggest any new site issues. You can see the site redesign in July helped with a lot of speed issues we were having earlier in the year.
This month our Avg. Page Load Time is at 10.93s – not exactly great in the grand scheme of things. Luckily as a blog site, we aren’t focused on generating conversions in the same way a typical eCommerce or lead generation site might be.
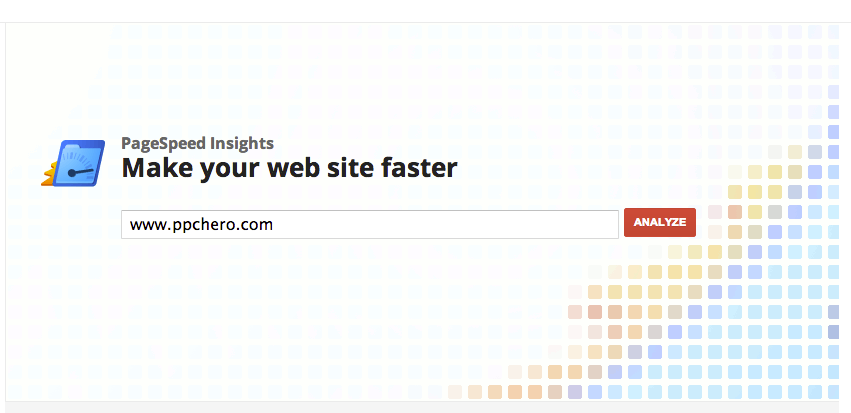
The second tool I like to use is Google’s PageSpeed Insights for developers.
This is another great way to get a feel for what Google thinks of your landing pages speed wise. It gives you a score out of 100 and suggests a number of ways for you to improve things.
Here I’ve run it for www.ppchero.com:
As you can see, Google ranks us an 85/100, which is exactly the average score of all our clients here at Hanapin. Pretty good, but still a lot of room for improvement.
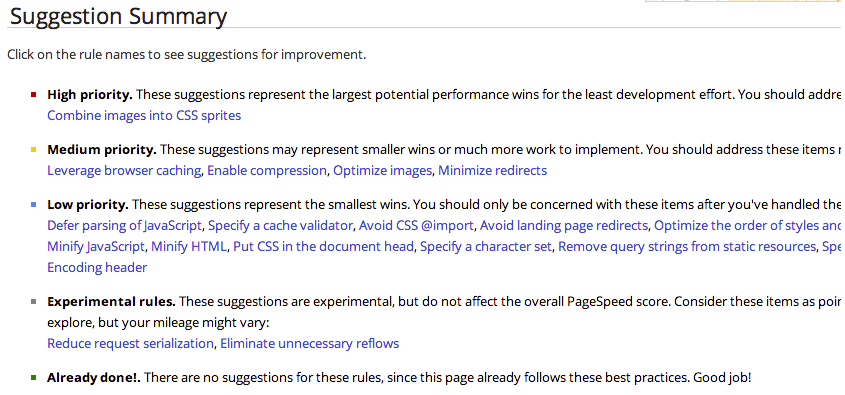
For those of you with web development experience, this tool gives you a few helpful tips for getting top marks. For us, Google suggests we combine our images into CSS sprites as a top priority. It also gives a number of medium and low priority items we could do to help speed things up. This report is something you could send over to your web-dev team to give them some ideas. Here’s ours:
Theory vs. Reality:
This is all great in theory. What’s the reality? I decided to take data from 7 of Hanapin’s clients across different industries and do a bit of analysis. For those of you with mathematical backgrounds, I looked into the correlation coefficient to see how closely site speed and conversion rate have been correlated over the past 12 months.

Your co-efficient (r) will be between -1 and 1, with -1 being heavily negatively correlated and 1 being heavily positively correlated. Zero means no correlation.
I won’t bore you with the math (see my link above if you want to be bored), but here is the correlation for the 7 clients I looked at:
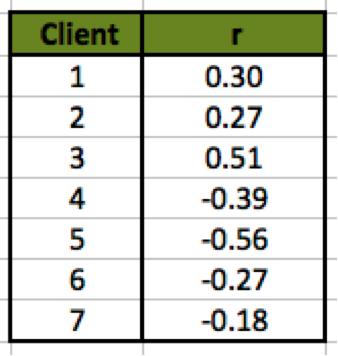
This table says to me that across my clients the correlation between site speed and conversion rate is insignificant.
To be honest, this is kind of what I suspected – we’ve been putting a lot of work into our clients (accounts getting better over time) and there has been a lot of seasonality. What this table shows me is that site speed is less important than all those other factors. Or to put it another way, other factors are more important than site speed.
I also don’t really have enough data, which is why I trust Kiss Metrics’ data more than my own for an accurate reflection of percentage change. However, it was interesting to look through and note that I couldn’t find any obvious effect.
The one thing I am wondering is if this is a case of correlation =/= causation. Perhaps sites with good conversion rates tend to be ones that are good businesses and spend time investing in making their site better, rather than specifically converting better because of a good site speed. Just something to think about.
What Should You Do About It?
Just because my data doesn’t show it, I still believe you should make sure your site speed is as good as it can be, particularly with the growth in mobile. I don’t know about you, but a slow loading site on my phone is one to which I won’t return.
I’d also make sure to check your own accounts for correlation between site speed and conversion rate – it could be really important for you. If you don’t want to go into a lot of math, you can create a scatter graph in Excel and add a trend line.
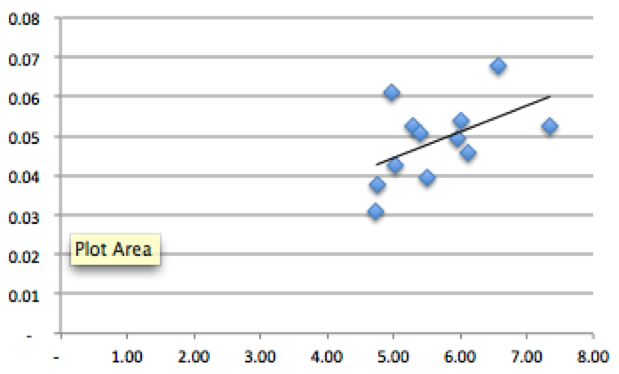
This is what my most strongly correlated account looks like in Excel.
Also, while there may not be a direct month-to-month correlation, it is clear Google will be adjusting your QS up or down based upon site speed factors. Leaving your speed to get worse over time will make life easier for your competitors and more expensive for you.
I’d love to hear your experience with site speed. If you’re interested in reading more, please refer to this awesome article over at Portent.com.


