Many sidebar ad thoughts have been bouncing around the PPC Industry as of late. Our own Kayla Kurtz wrote about her sidebar ads conspiracy while Matt Umbro spoke to what the announcement means for advertisers.
Now that Google has had the new layout of no side ads and 4 top ads (in highly competitive auctions) set up for a couple weeks, how do you know if your account has been impacted? Looking at clicks and impression differences week-over-week is a good starting spot, but to get the full effect of where ads are showing comparable to where ads were showing previous to the change, you’ll have to dig deeper.
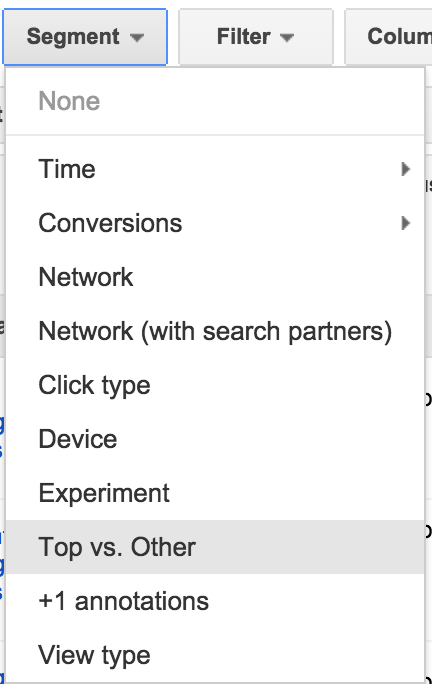
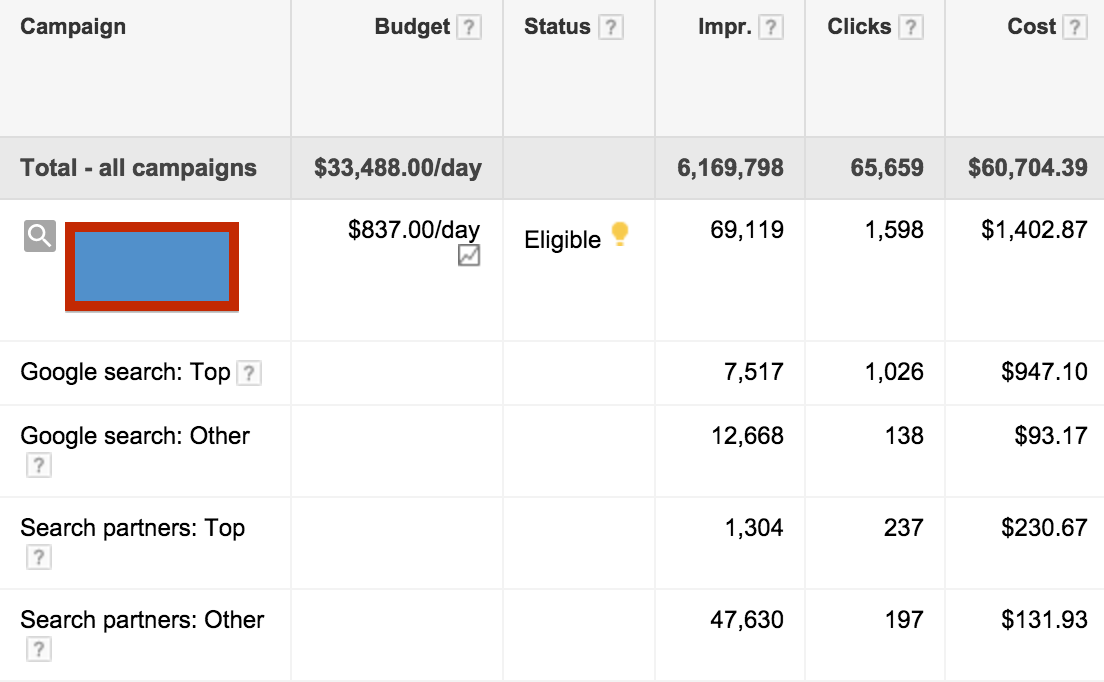
Utilizing segments is the first step by seeing how many impressions are showing above the organic results.
From here you can use the comparison tool to measure a number of impressions shown for top ads compared to the previous date range before the change. With AdWords current view, the data is tedious to analyze.
How do we lay the data out in a way that is easier to compare at the campaign and account levels? The answer is simple – Custom Columns. I say simple – but Hanapin Marketing Account Analyst, Rachael Law, (yes, the Rachael Law who will be at HeroConf in Philly) can be credited for bringing this idea to my attention).
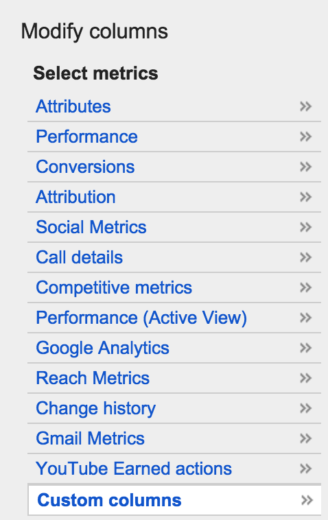
In order to get started with Custom Columns, you’ll first need to go to the “Columns” section.
Once you’ve chosen this section you can create a new column. You can then utilize metrics and segments of metrics to create new columns that are available to show in the interface:
You’ll then create this formula:
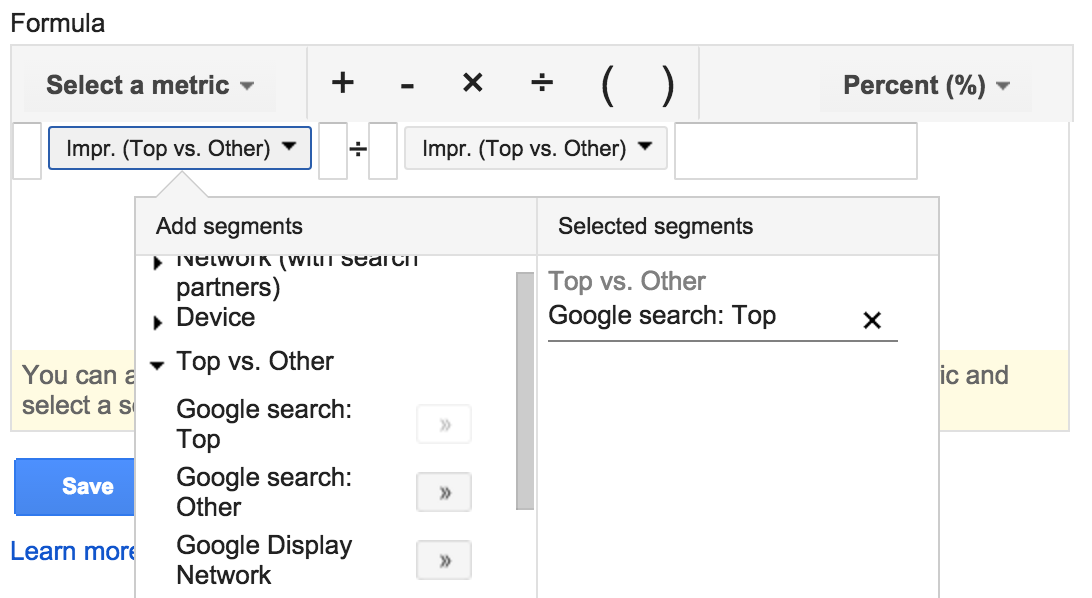
Google Top Impressions/All of Google Search Impressions
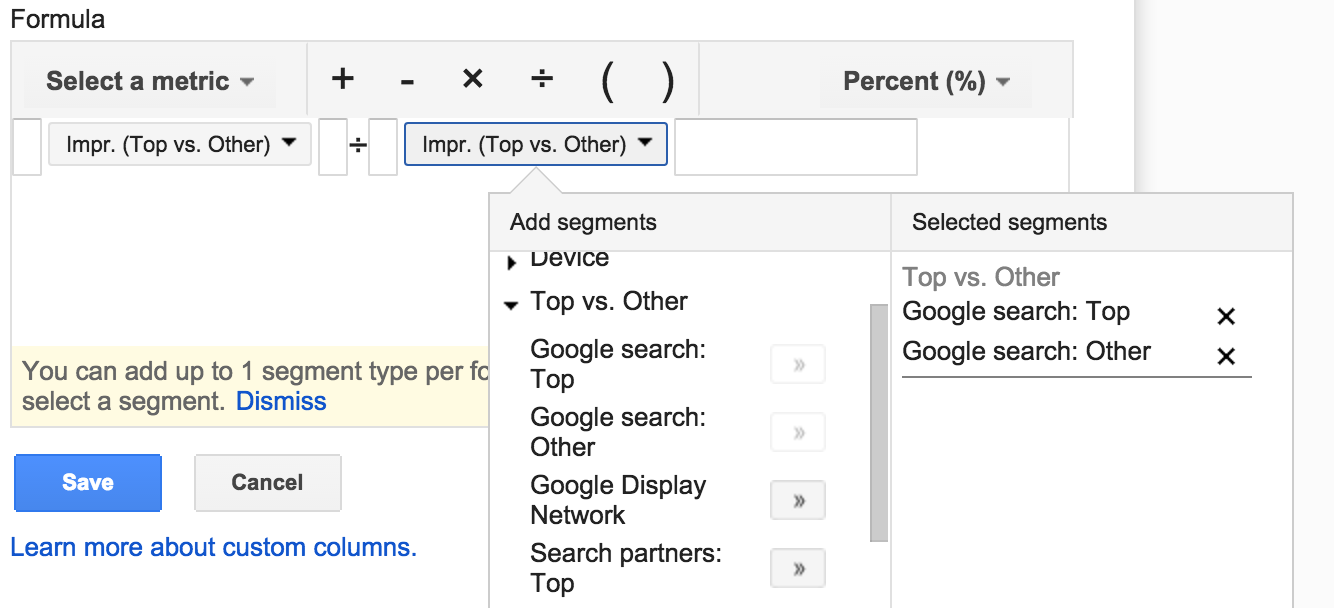
In order to do this, use the formula tool by choosing impressions as the metric and dropping down the segments and choosing Google search: Top beneath Top vs. Other. Then, hit the division sign, and choose impressions as a metric again, and select Google search: Top and Google search: Other to visualize what percent of impressions are top ads. Here’s how that formula is setup.
Set the metric as a percentage in the top right corner, and you now have your new metric. Check this new metric side-by-side with impression share to see the effects of your impressions with the Google changes as seen below.
In this particular account, we saw a balance in impression share with an increase in the percentage of impressions showing for top ads. Overall, these stats make it look like our ads received better visibility without missing out on further impressions.
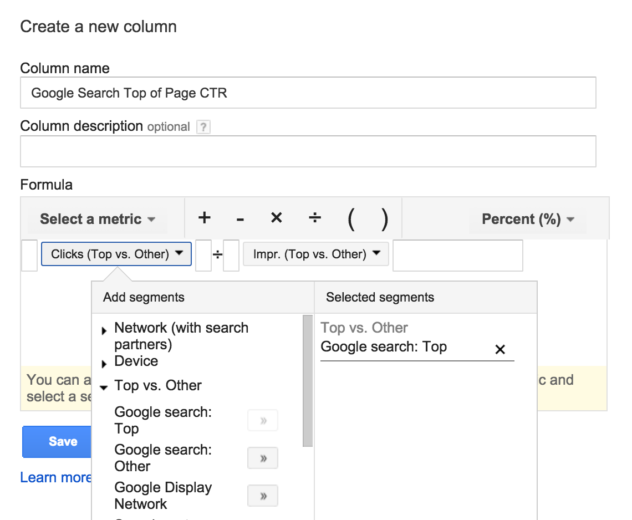
However, looking into the CTR differences is helpful. One metric you can add here is Top of Page CTR. This metric will help you visualize if having 4 top ads from time to time has brought your CTR down. In order to get this statistic in as a metric, you can go to custom columns and use the formula:
Clicks from Google search:Top / Impressions from Google search:Top
The image below shows the formula setup.
Once you have this metric in place you can do a before and after comparison.
Here you can see that the Top of Page CTR did take a dip overall from 7.81% down to 7.55%. However, the fact that more of our ads are now showing above the organic listings has, in turn, increased the total CTR from 1.10% to 1.16%. From an overall perspective, we can look at the increase in CTR and no decline in impression share and say thus far this new layout has been a win. The custom metrics allow us to tell the whole story, as we can visualize how much more often we are showing top ads and how the new layout impacts the CTR.
Final Notes
Use Custom Metrics and find out how the changes in the Google layout without sidebars has impacted your accounts.
It will help you gauge what you need to do differently from a strategy standpoint moving forward with the new layout. At the end of the day an overhaul of how your accounts are managed is unnecessary with these changes, but finding out how you are impacted and making the appropriate adjustments if needed is necessary.


