Audiences are everything in Facebook. They are the key way we target fans, customers, and anyone else we think might be interested in our product, service, or cause. They are the engine that drives all marketing on Facebook and understanding when we’ve maxed out reaching our audience is an important determination.
Audience fatigue is a real issue when running Facebook campaigns, especially when you have larger budgets and a relatively small audience. It’s not uncommon to realize you’re basically reaching the same people over and over again as your frequency numbers climb off the charts. This is where the fatigue issue comes into play as people just stop responding to the ads, at best, and at worst they actively hide them hurting performance and relevancy metrics.
The last thing we want is to alienate our fans and customers because we’re constantly in their news feed with the same messaging and creative.
So, what can we do?
Besides the previously mentioned frequency metric that tells you (within your chosen time frame) how often someone is seeing your ad on average, you can look to delivery insights to get a little bit more granular in understanding audience fatigue.
Delivery Insights is a Facebook tool that allows you dive deeper into how Facebook is delivering your ad to your chosen audience. While we will be focused on the fatigue issue here, there are also other tools that can be used to track changes to the account and performance as well as potential auction overlap.
Where Do You Find Delivery Insights?
In the ads manager you can typically find delivery insights when you are viewing your campaigns at the ad set level. You can then look under the delivery column and you will see next to each ad set a status for that particular ad set. It will either say “Active (Learning)” or just “Active” if its running or if it is not running it will be grayed out with a status (Complete, Inactive, Not Delivering).
One thing to note, is that if it states “Active (Learning)” there will be no delivery insights because the ad set is still in the learning phase. This phase is typically when an ad set first launches and the algorithm is collecting data and learning who it should be targeting based on your ad set optimizations. If you are seeing this in your ad sets, you will need to give them more time to collect data before seeing delivery insights. There is typically a bar that shows the progress toward completion of the learning phase.
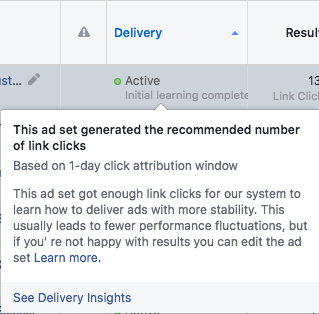
If you are out of the learning phase you should see something similar to the image below when you mouse over the status.

A drop down with a “See Delivery Insights” link at the bottom will appear and will lead you to delivery insights for that ad set/audience. Click on that link and you’ll be lead to a window where the delivery insights are housed. Near the top will be a menu with the various delivery insights tools available to you.
![]()
Let’s now see how we can understand audience fatigue better using Facebook’s Audience Saturation tool.
Diagnosing Audience Fatigue
Diagnosing audience fatigue is very important, but let’s start with a quick idea of what audience fatigue is and why it’s so important. We’ve all seen the same ad over and over till the point we are either actively annoyed or just start ignoring it all together. Maybe we actually try to hide the ad or maybe we just scroll past it very quickly, either way it’s not having its desired effect.
We’ve basically become fatigued by the creative and no longer wish to have anything to do with it. This is about as far from a desired outcome as we could get as a marketer.
So how do we get a handle on how much of our audience in Facebook has been reached and how does that inform our understanding of how fatigued they are?
Using the Audience Saturation tool we can utilize the metrics provided to start to build that understanding. The metrics we most want to pay attention to are First Time Impression Ratio and Audience Reached Ratio. You’ll also notice that the data is provided by day so you can see how these metrics are fluctuating over time.

First Time Impression Ratio
This metric tells us on the given day what percentage of people are seeing ads for the first time. When this is high it means a larger amount of people are being exposed to our creative for the very first time.
Audience Reach Ratio
This metric tells us how much of our potential audience we have reached so far. Each day it should get a little higher as more of the audience is reached till it tops out at a potential 100%.
How can we use these metrics to inform audience fatigue?
A low First Time Impression Ratio and high Audience Reach Ratio could tell us that we’ve reached a majority of the current audience and very few people are seeing the ads for the first time. For instance, using these metrics we might learn that 80% of our audience has been reached and only 10% or so are seeing one of our ads for the first time on a given day. That’s a solid indicator that we’ve likely maxed the audience. Especially if you have noticed performance declines.
It’s either time to refresh creative on this audience and/or create a new audience to start fresh all over again. If the audience has performed well there is always the option to use it as a source audience for a lookalike.
Conclusion
Understanding audience fatigue on your Facebook campaigns is an important part of diagnosing performance declines and getting the best performance you can. Make sure to include Delivery Insights and the Audience Saturation tool in your tool box of ways to analyze your campaign performance.


