A good click-through rate is one of the most fundamentally important parts of any paid search account. It’s the primary metric Google uses to judge us, determine our quality scores and set our cost-per-click (CPC) in the auction.
However, loads of us still make the mistake of treating every click equally. We’re taking a lazy approach with our ads and accepting aggregate data to determine testing winners. What if I told you that this leaves thousands of potential clicks on the table?
It also messes with the way we think about statistical significance. Let’s say we have an ad with 100 impressions and 20 clicks, and another add with 100 impressions and 15 clicks. Traditionally we would recommend running this through an A/B calculator, waiting for it to tell us it was 95% confident that ad A was better than ad B, and be done with it. That might be a fair assumption in a fixed environment, but it doesn’t really cut it for AdWords and PPC. There are too many variables. Every impression happens under its own unique set of circumstances. To that end, I’m going to dive into five ways you can segment your ad tests and show you how we’re all failing to maximize our CTRs.
For a more detailed look into arguments against using statistical significance with ad tests check out this great Twitter thread from @RichardFergie.
1. Stop including search partners in your CTR
Take a look in the screenshot below. It’s an ad from a campaign I’ve been investigating for low click-through rates. It turns out the CTRs aren’t actually all that bad compared to average; the campaign just happens to have a ton of search partner traffic which is pulling down the numbers. As a rule, I now look at my CTRs with search partner data excluded because it levels the playing field across my tests.
There is a much wider variety of search partners – from Amazon, which has really low CTRs, to ask.com, where CTRs aren’t too different from Google – than there are differences between ads on the Google search results page.
You should also note that your quality scores will come from your Google search only and not from search partner click-through rates. Due to the wide variance in search partner CTRs your performance is judged per partner – you’ll stop showing on Amazon if your Amazon CTRs are awful, but it won’t impact your Google SERP QS.
2. You need to be using mobile-preferred ads:
We conducted a case study on the impact of spinning out mobile-preferred ads and concluded that it led to roughly 19% higher CTRs. Taking the aggregate of all devices was causing people to conclude tests in favour of ads that had good overall numbers but weren’t necessarily the best for a specific device.
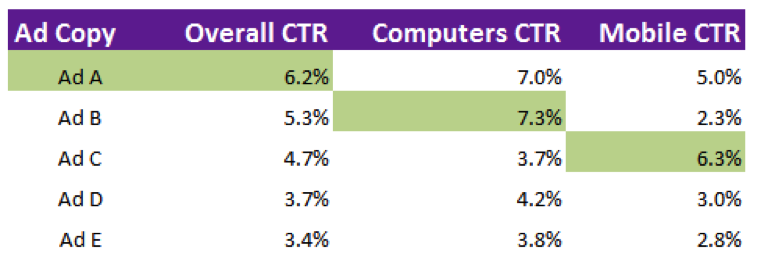
Take a look at this table:
Without segmenting CTRs by device, we conclude that “Ad A” is the winner, despite the fact it’s not the best ad for either mobile or computers. By setting “Ad B” as our all devices ad, and “Ad C” as mobile preferred we were able to boost CTRs and pick up clicks we were previously leaving on the table.
3. Your ad tests are showing at different positions
I’ll bet when you run your ad tests, almost 100% of the time you see that your ads have been showing in slightly different positions. That’s an important variable to account for, and one we tend to sweep under the rug because we don’t know what to do with it. Which of these two ads is better?
- Avg. pos = 2.7, CTR = 2.65%
- Avg. pos = 3.4, CTR = 2.05%
I’m guessing that like me you’re going to pick the first one because the CTR is higher. It also makes sense to us that if the average position is higher, Google has probably made a judgment call about our ad quality score and relevancy, and started to show it in a higher position. However, I want you to be clear that this means any kind of statistical test you want to run on these ads is fairly void at this point. It simply isn’t a fair test. We are bowing to Google’s interpretation of the value of our ads and that’s it (it’s fine to accept the first ad as the winner in this case).
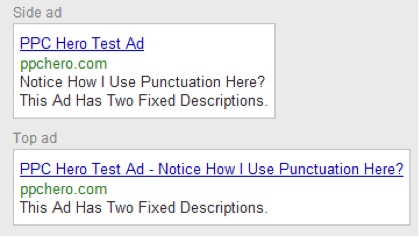
There’s also another big variable. Some ads perform differently whether they appear on the top or at the side. Take a look at the top examples I made below:
This first ad uses punctuation at the end of description line 1 to pull that line into the heading when showing in the top positions (1-3).
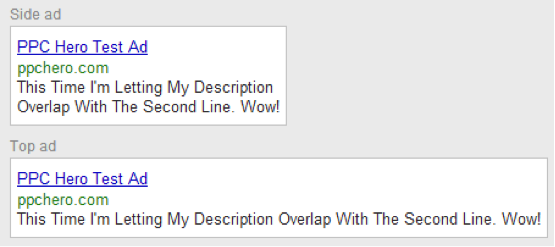
My second ad has a run on sentence between description lines 1 and 2. I think this is a better ad personally because my copy can be more compelling – I haven’t artificially broken it up.
I looked at ad tests in my accounts with similar set ups and found that ads with punctuation tended to be about 9% better than run-on ads in the top positions. However, outside of those top positions my run-on ads were performing 50% better. If you are going to make some dramatic bid increases or decreases, (increase bids to top of page etc.) then you want to think about how this will impact the validity of your previous ad tests.
4. Multiple keywords are muddying your ad test results
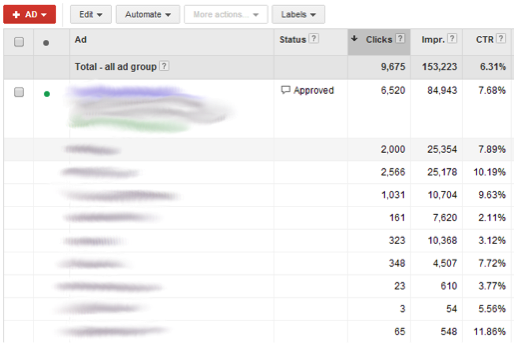
What percentage of your ad groups contain just one keyword? Even with the best of intentions I’m guessing less than 100%. That means you’re taking the average of your CTR across multiple keywords. Here’s a quick example from one of my ads from an ad group of 9 keywords:
The CTRs here vary a ton by keyword. The swing is from 10.19% for one keyword, to 2.11% for another. What if that 2.11% is because this ad doesn’t work well with that keyword? Let’s look at another ad test I ran in one of my other accounts.
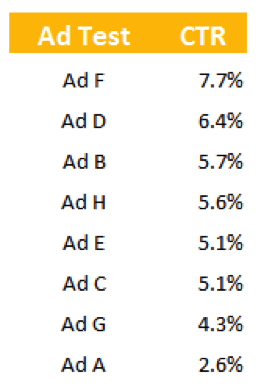
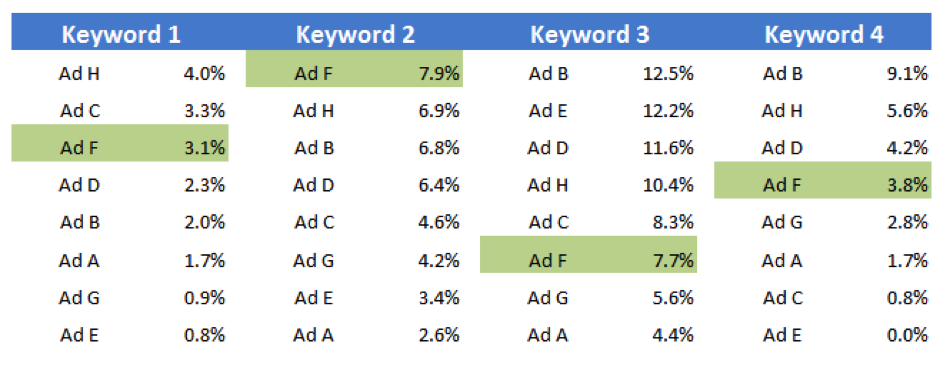
Ad F is clearly the overall winner here, getting a 7.7% CTR. However, when we break this down by individual keywords it paints a very different story.
Although “Ad F” was our overall winner, it was only actually the best ad for one of our four keywords. It was 3rd best for Keyword 1, 6th best for Keyword 3 and 4th best for Keyword 4.
I pulled some numbers quickly to show the impact of going with “Ad F” as our overall winner.
- Total Clicks = 8,520
- Potential Clicks = 10,425
- Lost Clicks = 1,905
This means had we gone with the winner of each ad test for the keywords above rather than just use “Ad F” we could have generated an extra 1,905 clicks in the past month. That’s a huge percentage of clicks to leave on the table. If you aren’t doing it already this further highlights the importance of Single Keyword Ad Groups (SKAGs) for your most important keywords.
5. Different ads work better on certain days of the week
There are many timing factors that affect customer behaviour.
- Day of the week
- Hour of the day
- Point in the month (close to payday?)
You might have an ad that appeals to customers trying to buy something quickly during lunchtime before they have to get back to work. Another might work well over weekends and drive store traffic. These outside factors need to be accounted for. Ad tests do not happen in a vacuum. If you assume one of your ads is the best because it does well overall you run into the same problem as we did in the keyword section above – potentially leaving thousands of clicks on the table by having suboptimal ads running on certain days.
It’s not always realistic to say we have the time or data to dissect our ads into a million different segments, but we should always be thinking about these factors and trying to get better. I’d love to hear your own stories about segmented ads in the comments below!


